by Pinchas Cohen

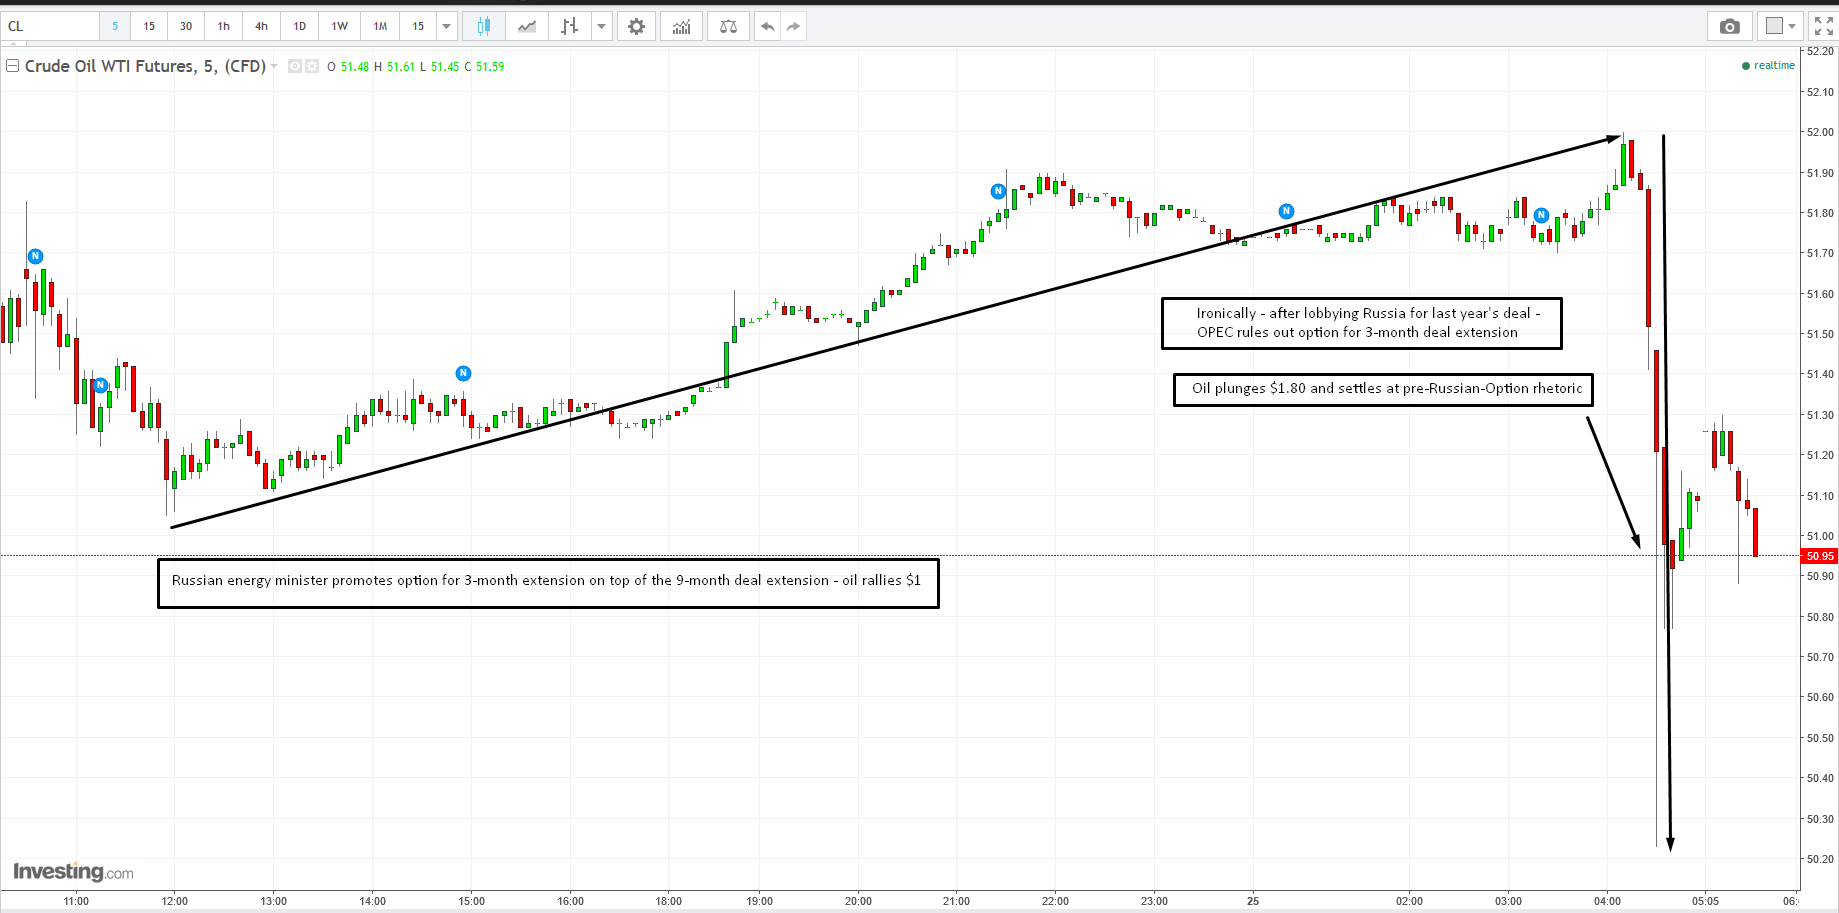
Yesterday, the Russian energy minister put forward the possibility of including an additional extension of three months on top of the already extended oil production freeze deal's nine month extension. WTI rallied, up another dollar until OPEC ruled it out earlier today. Between 4:30 and 4:32 EDT WTI plunged 2.58%, losing $1.33, at the price of $50.17.
The initial rally on the possible additional three month extension, and the plunge when the possibility went away, formed a mega, 3-day Bearish Engulfing pattern. In other words, the bulls worked hard for three days, but the bears managed to push them back in an hour. That’s a bad omen for trader psychology with regard to the commodity.
The original production freeze deal signed by OPEC members on November 30, and by NOPEC countries on December 10, 2016 was the first global oil pact since 2001. Markets didn't believe it would actually happen, nor did they believe that if it did happen it would remain in force for the duration.
To everyone's astonishment, it happened and it did. From the November 30 low of $45.22 to the January 3, 2017 high of $55.24 the price of a barrel of crude jumped a whopping $10.02, or 22.16% in just a little over a month.
However, US shale production ramped up and kept a lid on the price, which failed to make any new highs. Rising US production and inventory weighed heavily on oil's price, pushing it down from the February 24 high of $54.94, a mere 30-cents below January's peak, after it bottomed at $26 a year ago, in February. The price dropped to a low of $43.74 on May 5, a loss in value of $11.18 or 20.35%, in two-and-a-half months.
OPEC and NOPEC to the rescue. Talk of a production cuts extension started and price rallied—from the May 5 low to today’s high, an even $52.00, right before OPEC put the kibosh on the Russian three-additional-month-extension option.

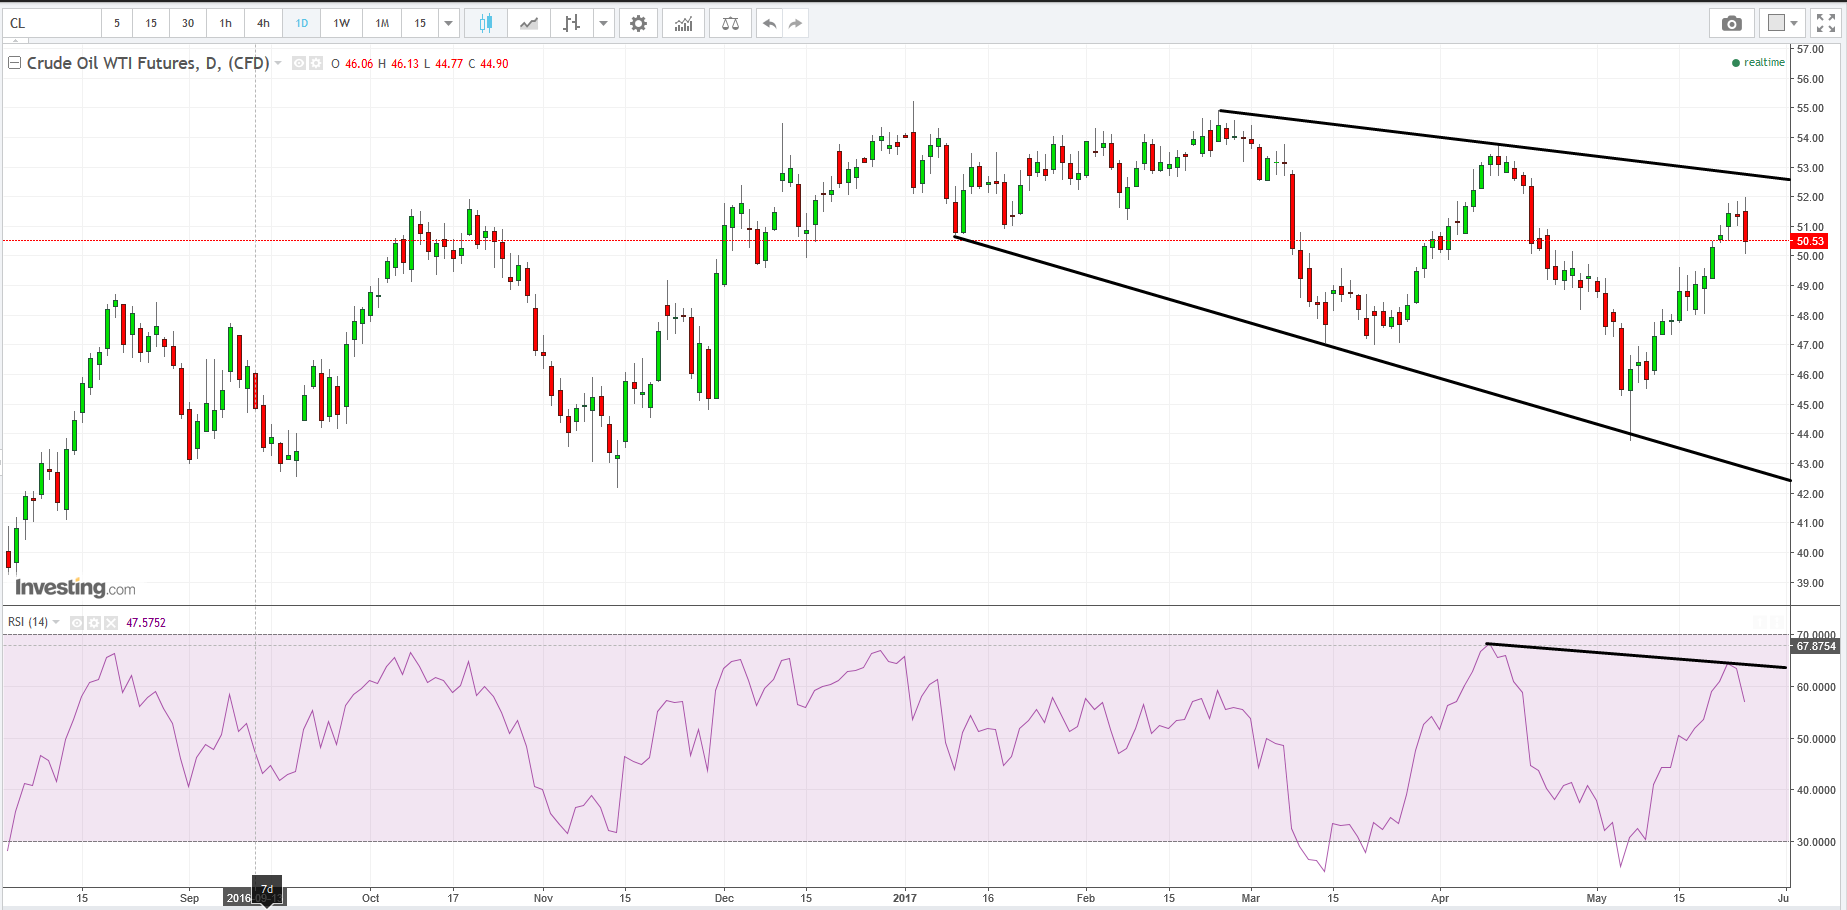
The trading pattern between the February 24 high and the May 5 low formed a declining channel, which demonstrates that overall, supply is overcoming demand. Perhaps more importantly though, both buyers and sellers agree that prices will decline. Why else are buyers willing to buy – and sellers willing to sell, but only at lower and lower prices?
Lower Highs, Higher Lows
The current rally is nearing the top of the falling channel. That’s when the High Wave candle formed. It is a critical juncture both in price—for being near the channel top, as well as event—the non-US oil production cut deal which has been the biggest oil driver since November.
Now, look at the proportions of the channel. Note that each decline is steeper than the previous one. On the other hand, each rally is similar in proportion to previous rallies.
Between the first time price hit the ceiling on February 23 with the high of $54.94, and the second time it tops out on April 12 with the high price of $53.76, there's a decline of 2.14%. Similarly, the decline between the April 12 peak and today’s peak, with the high price of $52.00 is a decline of 3.27%.
On the other hand, between the first time oil's price reached the bottom of the channel on January 10, with the low of $50.71 and the second time it reached the channel bottom on March 14 with the low of $47.09, there's a difference of 7.21%. And again, between the March 14 low and the next time it hit a bottom, on May 5 with the low of $43.76, there's a decline of 7.07%.
The setbacks in price are double the percentage, and actual dollar value, than those of the advances on the rallies. This clearly shows where the strength is. We're seeing lower highs and higher lows.
The Relative Strength Index too, which measures the speed and change of the price movement, is confirming oil’s downward price movement. Note that the momentum indicator fell below the oversold threshold on both price declines of March and May, but never rose above the overbought threshold on the following rallies. Moreover, the price failed to reach the channel top, and that weakness is projected in the leader indictor, the RSI, as it failed to reach the overbought threshold but curved back down in defeat.
Target Price
After testing the May 5 low of $43.76, the channel leads lower. If the 7% between troughs pattern remains, we can expect it to reach $40.70. The time between the troughs was 6-8 weeks. We can use that as a gauge for the duration of the trade.
Trading Strategies
Conservative traders may wait for the price to rise to the top of the channel, $52.70 per today’s angle, before they short.
Moderate traders may wait for a correction to retest today’s high, or close to it, at $52, before they short.
Aggressive traders will realize the combined fundamental and technical outlook and jump on the most attractive risk-reward ratio, between the resistance of the channel top, or even the April 12 peak of under $54, and the May 5 low of under $44, and short right now, while managing their funds to allow fluctuation toward resistance.
