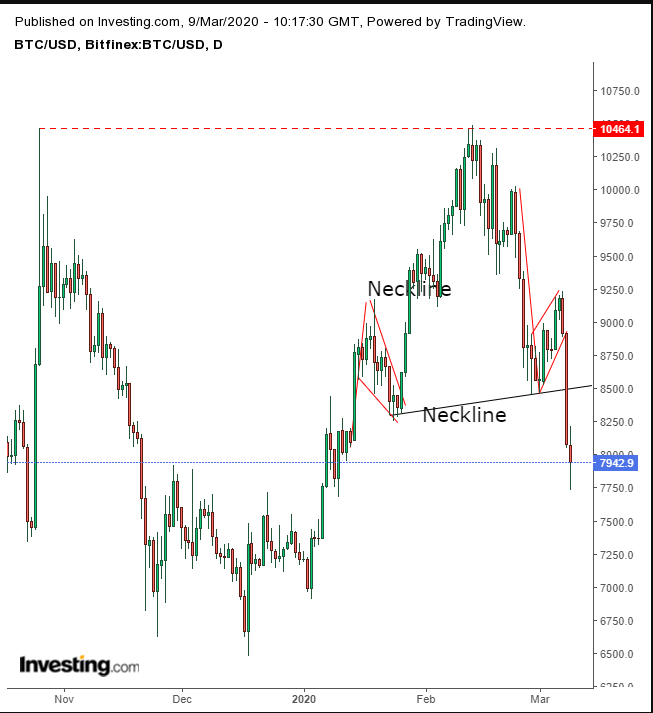
Bitcoin has been going wild. The cryptocurrency is currently down 1.7%, having trimmed an earlier 4% plunge.
Yesterday the digital currency lost 9.4% of its value. The largest crypto by market cap is down for a third day, showing a total loss of 13.5%, at the time of writing.
Rather than being treated by traders as an alternative safe haven, Bitcoin instead seems to suffering from the current market turmoil, as a second, stronger wave of coronavirus fallout takes hold of global financial markets— on top of a savage oil price war being waged by Saudi Arabia and Russia.
Since some have referred to Bitcoin as “digital gold,” we would have expected it to act similarly in this market environment. At this juncture, however, perhaps the common wisdom that cash is king may have pushed gold lower, after it penetrated the $1,700 level. Which could also explain why BTC/USD continues tumbling.

Bitcoin's rising flag, which we wrote about last week, has further developed its rising flag, completed it and achieved most of its target.
At the same time, it completed a H&S top, whose implied target is about $6,500. That's another example how the technical charting puzzle comes together, as that level happens to also be the December 2019 lows.
The same symmetry is visible with the pattern’s head realigning with the Oct. 26 high. As well, it's now clear that the H&S shoulders were flags: a falling, bullish one on the way up and a rising, bearish one, on the way down. Finally, the price found support by the November highs.
Trading Strategies
Conservative traders would wait for a return move to the neckline at $8,500, which will prove a resistance.
Moderate traders are likely to wait for the same upward correction, but for a better entry rather than to verify the trend.
Aggressive traders may enter a contrarian long position, to ride the probable short-term rally.
Trade Sample – Aggressive Trade
- Entry: $7,800
- Stop-Loss: $7,700
- Risk: $100
- Target: $8,300
- Reward: $500
- Risk:Reward Ratio: 1:5
