China's internet e-commerce giant Alibaba Group Holdings (NYSE:BABA) just reported corporate results, ahead of the start of the US session. According to Reuters, the Hangzhou-based company:
"Beat quarterly revenue and profit estimates on Thursday as its core commerce and cloud computing businesses benefited from a shift to online shopping and working from home due to the coronavirus crisis."
It's doubtful any investors are surprised at BABA's results since the company had already seen pre-pandemic growth in mid-May, and COVID-19 lockdowns and business closures have been a boon to online retailers. Shares of Alibaba, which closed yesterday at $260.59, are up +20% YTD.
But a variety of headwinds, including a resurgent US-China trade and diplomatic spat, still-raging coronavirus outbreaks both in China and worldwide and White House threats of stricter auditing regulations for Chinese companies listed on American stock exchanges could pressure the stock, even after its earnings beat.
What does the trading pattern suggest about the stock's next move?

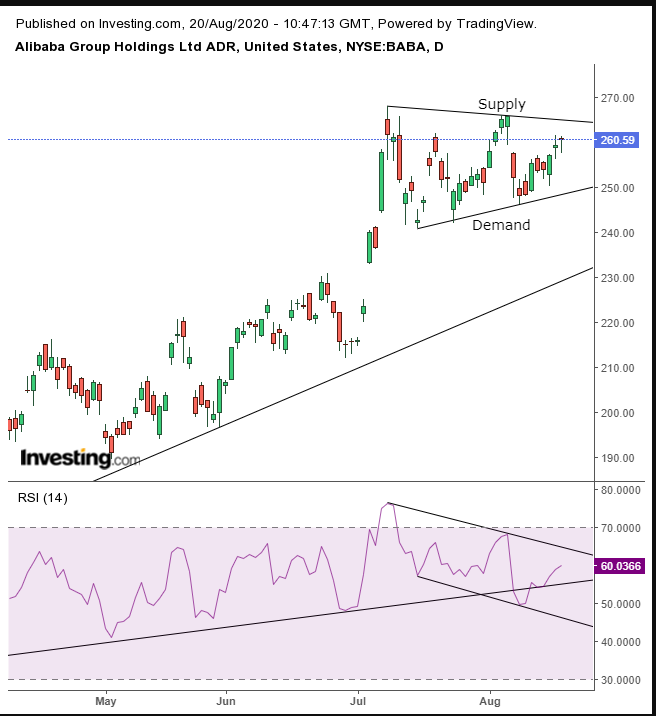
The stock has been ranging within a symmetrical triangle since the June 19 all-time high. The pattern’s even distribution between supply and demand, which has been causing highs to fall as sellers reduce the price of offers, while lows rise as eager buyers increase their bids—to ultimately meet somewhere in the middle—shows that traders are unsure about the direction of the stock.
This uncertainty is amplified when such a pattern occurs right before earnings, suggesting it’s the event traders are looking for to help them make a decision about how to proceed.
The stock’s neutral pattern placement on the chart—above the uptrend line—does provide the argument for better odds for an upside breakout, in the direction of the underlying trend. Furthermore, the RSI managed to climb back above the uptrend line after spending three days below it.
Still, the momentum indicator provides a negative divergence, having fallen lower, while the price remained higher, establishing a falling channel for momentum, which may mean prices could head lower.
But, since earnings beat expectations, the next leg could be an upside breakout. Should this occur, it would set in a motion a bullish chain reaction. However, if guidance should fall short, or not provide a reason for exuberance, a dip may bring the price to the bottom of a presumably bullish pattern, or even down to the uptrend line—providing a buying opportunity within the uptrend.
Trading Strategies
Conservative traders would wait for either an upside breakout or a return to the uptrend line and wait for evidence of accumulation. The pattern completion would include a minimum of 3% price penetrations amid a minimal period of 3 days, preferably to include the weekend, then wait for a return move to retest pattern integrity.
Moderate traders are also likely to wait for either an upside penetration or may be content with a return to the bottom of the pattern, going long upon signs of support. A moderate filter to avoid a bull trap may be satisfied with a 2% move, over a two-day period. Return moves are welcome for buying dips, not necessarily proof of trend.
Aggressive traders may also wait for the pattern completion or a return its bottom. The required upside penetration would be at least 1% with a close above the pattern. A return to the bottom may trigger long positions, without waiting for evidence of a rebound.
Trade Sample – Aggressive Long Positions
- Entry: $268
- Stop-Loss: $264
- Risk: $4
- Target: $288
- Reward: $20
- Risk:Reward Ratio: 1:5
Note: This is a trade sample, not a prophecy. No one knows what will happen. Trading is about attempting to increase one's odds of winning, so that over time—rather than on trade-by-trade basis—one's actions will be profitable. This trading sample is generic. It's not tailored to a specific person, budget, temperament of timeframe.
