American International Group (NYSE:AIG) is floundering in a long-running, negative streak of disappointing data. Over the last eight quarters, the insurance multinational disappointed six times on earnings. That’s not a good track record, by any measure.
However, it may be about to break that painful streak in tomorrow's earnings release, if the signals being sent by the balance of supply and demand are correct.
The insurance giant publishes corporate results tomorrow before market open for the fiscal quarter ending December 2019. Analysts expect it to report EPS of $1.01 on revenue of $11.61 billion.
These estimates are based on the view that AIG is likely to have increased its profits through higher pricing, the 2018 acquisitions of Validus and Glatfelter, lower catastrophe-related claims, ongoing underwriting, the reselling of policies and finally, heightened cost discipline.
And looking at the chart, there's something quite interesting that should catch people's attention.

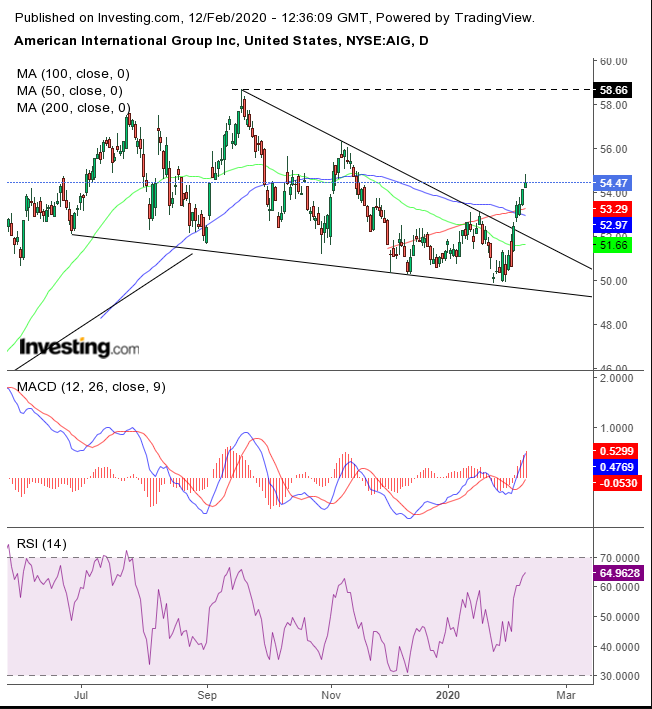
Last Thursday, the price broke free of a range for the first time since June 2019, exactly one week before the release of corporate results. Any sudden change in investor activity is worth keeping an eye on, but when it occurs a week before earnings, it’s worth keeping both eyes wide open.
The breakout includes a six-day straight advance of as much as 5% — even while the broader market was suffering a selloff — which took it past the 50, 100 and 200 DMA, one after the other, all in one fell swoop.

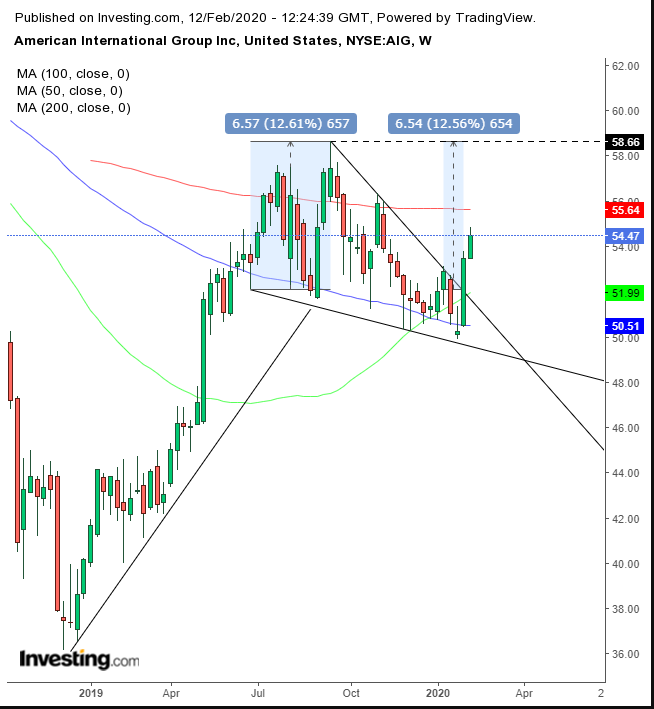
In the weekly chart, the price found support by the 50 and 100 WMAs and cut through the range’s top barrier. It's now eyeing the 200 WMA, under $56.
The pattern that emerges is a large falling wedge, considered bullish within an uptrend. This should be viewed as especially promising when taking into account the 10% surge in one week in early May 2019, before prices bunched up into what turned out to be a congestion.
The psychological driver of a falling wedge is similar to that of a flag, in which stronger hands take shares off weaker hands. The pattern tilts down, because of the supply pressure, but is congested rather than depressed, because of the existence of demand.
Finally, when supply is depleted, buyers are forced to raise their bids to find new, willing sellers, taking them out of the pattern.
The implied target is expected to be the height of the pattern from the point of breakout. Another practice is to aim for the highest price in the pattern. In another example of technical harmony, the two coincide. The height of the pattern is $6.57 — and that measure from the point of breakout takes you to the top of the pattern. However, this rarely occurs.
Return moves are common — and note yesterday’s shooting star, which connotes tiredness. Also, the RSI is nearing an overbought level, while the lagging indicator MACD is still firmly in a bullish posture.
Therefore, even if the news isn't good, it could already be priced in, at least for the first leg, which may well have been driven by informed money.
Trading Strategies
Conservative traders avoid trading earnings. After the release, they’d wait for a full return move to retest the pattern’s integrity.
Moderate traders are likely to wait for the same pullback for a better entry, not necessarily to seek confirmation.
Aggressive traders may enter a contrarian short, counting on market mechanics pulling down the price first, like the pulling of a bow before release. Cautionary note, while traders may employ stop-losses, those may easily be skipped over amid a gap, incurring much more losses than the trader intended. This move is only appropriate for savvy traders with the right temperament.
Trade Sample - Short Set-Up
