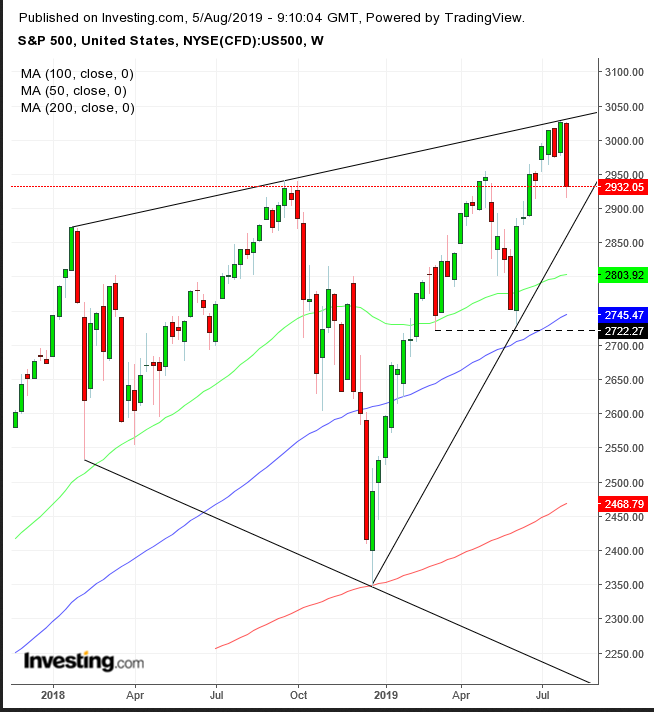
Last week, the S&P 500 suffered its worst weekly performance this year, yet all indications are that this week will be even worse. The index could be heading for an even greater selloff this week, after last week confirmed the major reversal pattern we warned about over two weeks ago.
President Donald Trump shocked China and markets when he announced $300 billion Chinese goods will incur 10% tariffs, just when both China and the market took a breather on renewed talks. However, Trump charges China with violating pledges to increase agricultural imports toward balancing the trade between the two countries.
While it may appear impulsive and irrational for Trump to take this track just as talks restarted, it may well be a planned out strategy. Fed Chief Jerome Powell was clear the central bank lowered rates as a result of trade war consequences. Trump promised his base a trade war, and he has been after the Fed to ease for a long time. Two birds, one stone.
Trump was openly disappointed with the Fed’s 25 basis point cut, rather than the 50 basis points some hoped for, and with Powell’s clarification that this cut was nothing more than a “midcycle adjustment, ” not – God forbid – a policy shift.
And so, that became Trump’s cue to shoot the next tariff salvo.

The S&P 500 traded within a broadening pattern since January 2018, with highs making higher highs, while lows made lower lows. This is a top formation, and a sign of chaos, because if investors had faith in continued profits, they would trade it up – with both highs and lows. Conversely, if traders expected profits to shrink, they’d sell off – with both highs and lows.
However, the pattern is only complete when its lower boundary is breached, which is tricky, since it keeps falling. In other words, prices have to fall hard and fast, to beat the lower boundary’s decline and complete this bearish pattern.
Meanwhile, the short and medium-term lines are up. Should this week resume last week’s selloff, it would test the medium-term uptrend line since January 2019, while a fall below 2,720 would be the next trend’s test, where the previous two rallies began.
It’s reasonable to expect it to, considering China’s retaliation. Trump hasn’t shown himself to be the kind of guy to back down from a fight.
Trading Strategies
Conservative traders should avoid this trade and wait for the pattern to blow out, taking a long position with higher highs, or wait for the broadening pattern’s completion to short.
Moderate traders are likely to wait for higher highs – blowing out the pattern – for a long position. or wait for the medium term to reverse with peaks and troughs in a descending format.
Aggressive traders might enter a contrarian trade and buy the dip above the uptrend line, and wait for it to be breached for a short.
Trade Sample
- Entry: 2,880
- Stop-Loss: 2,870
- Risk: 10 points
- Target: 2,910
- Reward: 30 points
- Risk-Reward Ratio: 1:3
