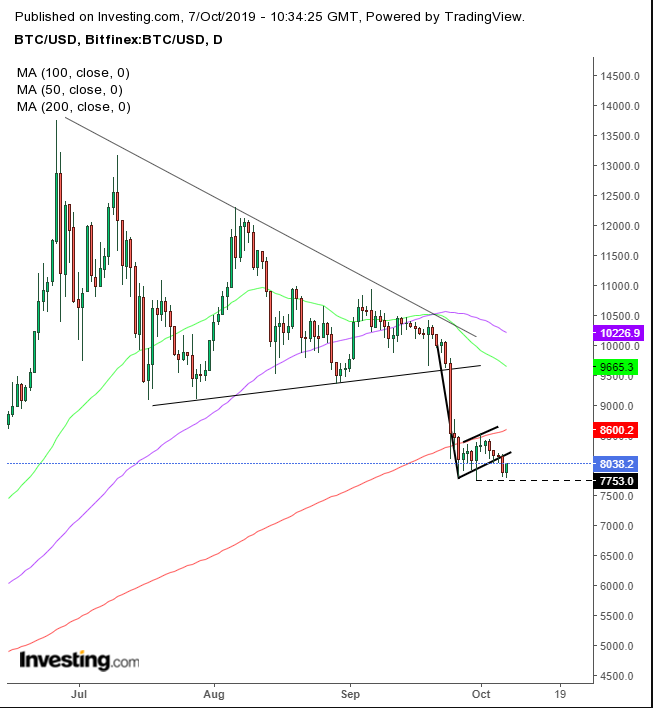
Bitcoin is down by almost 25% since its Sept. 3 close. That was the top of the last rally since the price began moving with a downward bias after the June 26, $13,764 high. And the likelihood is that it's heading even lower.
As a decentralized asset, there's always been speculation and disagreement on what moves the price. The current fundamental driver may be fractional reserves practices, potentially increasing what was always considered a maximum of 21 million coins. The outlook for a higher supply reduces current demand: 18 million have already been mined.
Meanwhile, it's failed to recover from its 20% percent drop in two days. Nor is it likely to. The chart below helps illustrate why.
That 20% plunge was a downside breakout of a triangle top. The consolidation that followed — that failed to create upward momentum and attracted no dip buying — is deemed bearish. At the same time, the upward bias suggests profit taking, allowing new blood to take the place of previous investors for the next move, presumably one that's downward.
This pattern formed a rising flag, bearish after a sharp move, whose setup for another leg in a downtrend is strengthened by its upward tilt, as described. The fact that the bearish flag formed as part of the very breakout that completed the previous bearish pattern emboldens the pessimistic picture.
In addition, the 200 DMA realigns with the flag top, reinforcing it as a resistance. And finally, Sunday’s downward breakout signals that the new investors have the same intentions as the previous ones – to sell and move on, creating another slide down.
Trading Strategies
Conservative traders would wait for a significant downward move, followed by an attempt to return above the flag, whose failure would confirm the downward trend.
Moderate traders may be content with a close below the Sept. 30, $7,753 low, followed by a pullback to at least provide a better entry, if not to increase the odds of a continued downtrend.
Aggressive traders may short now.
Trade Sample – Short Position
