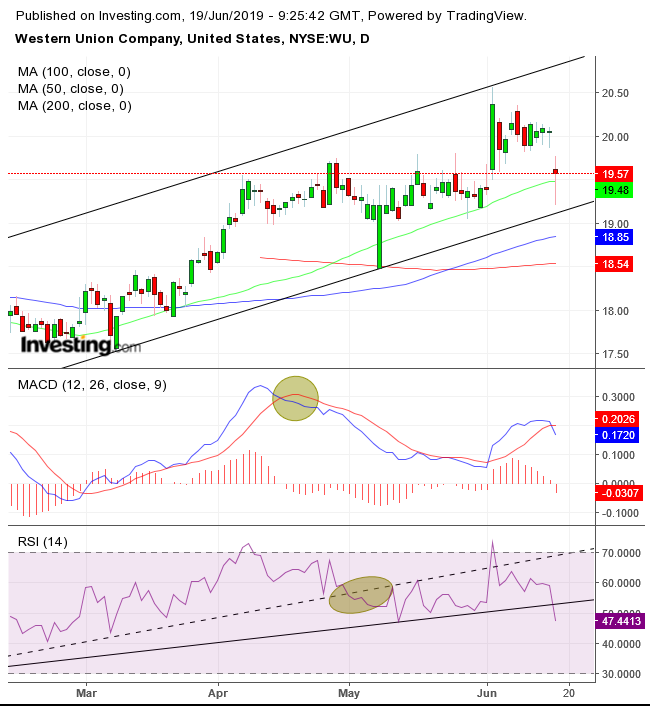
Western Union (NYSE:WU), the money movement and payment services company, dropped as much as 4.3% Tuesday, making it one of the worst performing stocks on the S&P 500, as investors priced in the potential for free money transfers overseas with Facebook (NASDAQ:FB)’s newly announced cryptocurrency, Libra.
However, the social media giant, already under scrutiny for its monopoly and privacy law abuse, may find it takes somewhat longer to launch Libra than it had hoped. U.S. lawmakers yesterday demanded Facebook halt its crypto plans pending Congressional approval, while their European counterparts were also quick to call for scrutiny of the project.
Still, the excitement around Libra raises the specter of whether Western Union will be seeing its main source of business erode dramatically. Consumer-to-consumer money transfers make up 79% of the company's revenue, according to its Q1 report published on May 7. This doesn't help the stock, which, as technical analysis suggests, could be set for a deeper tumble.

Western Union has been trading within an ascending channel since the beginning of the year. The pattern demonstrates that while there have been dips, they were profit-taking corrections amid a rising trend. In other words, both buyers and sellers agree the stock is underpriced.
Even yesterday’s plunge found support by both the channel bottom and the 50 DMA. However, both the RSI and the MACD triggered sell signals—only the second time since the development of the rising channel.
While the 50 DMA crossed above the 200 DMA last month—triggering a golden cross, a signal that's closely watched by many, not just technicians—the 100 DMA lends credence to the channel bottom. In addition, the RSI fell below its uptrend line of the same period.
Since momentum tends to lead price, it raises the odds for the price to fall below its own channel bottom, retesting the 200 DMA for the first time in 6 weeks.
While the RSI is a leading indicator, the MACD is a lagging indicator. So, when its short MA crossed below its long MA, it demonstrated weakness in current prices, bringing up the rear to the leading indicator.
Trading Strategies
Conservative traders would wait for the price to complete a descending series of peaks and troughs before considering shorting the stock.
Moderate traders may risk a short position, if the price falls below the 200 DMA and demonstrates its resistance properties, with at least one long red, candle engulfing a green or small candle of either color.
Aggressive traders may short at will, providing they prepare a detailed trading plan they’re committed to that fits their account and temperament. Also, they should expect volatility amid a Fed policy meeting.
Trade Sample
- Entry: $20
- Stop-Loss: $20.50
- Risk: $0.5
- Target $18.50
- Reward: $1.50
- Risk-Reward Ratio: 1:3
