Facebook (NASDAQ:FB) dropped 1.7% yesterday after a Wall Street Journal report said CEO Mark Zuckerberg may have known about his company’s controversial privacy practices. The social media behemoth is now concerned that the emails linking Zuckerberg to the scandal may be used against the company during a recently announced Federal Trade Commission (FTC) probe.
Meanwhile, COO Sheryl Sandberg has sold 330,000 shares since late March, for as little as an average of $164.34 a share. It isn’t a good sign when one of a company’s senior employees sells shares, and the timing raises questions about whether this insider believes their value is about to decrease.
But this isn’t necessarily the worst of Facebook’s problems. The FTC is preparing an antitrust lawsuit against the company as it cracks down on the biggest tech companies, to see whether they have engaged in anti-competitive practices.
Goldman Sachs has warned investors that antitrust lawsuits might be a sell signal. Technical analysis concurs.

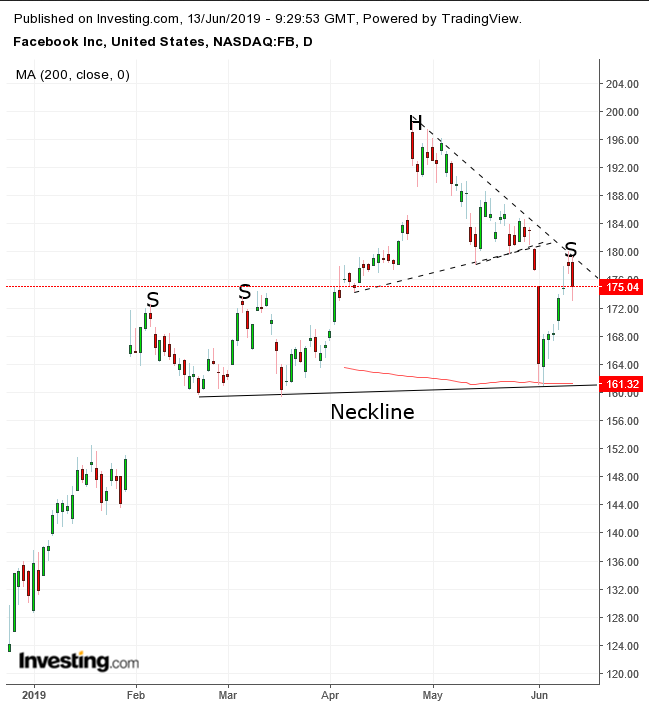
The social media giant’s stock price may be developing a H&S bottom having confirmed a confluence of resistance points: the $180 level after the price fell from the downtrend line since the late-April peak.
The downtrend line may also be considered the top of a symmetrical triangle, whose downside breakout demonstrates that supply has swamped demand. The triangle also makes up the head of a complex H&S top.
Yesterday’s decline may be forming a right shoulder. The neckline’s significance is underlined with the 200 DMA, which is reinforcing its support/resistance feature, setting up the $160 price as a springboard for a violent move.
Trading Strategies
Conservative traders should wait for a downside breakout of the neckline, with a close below $158 to include a 3% penetration to filter out a bear trap. They would do well to also wait to see that the price remains below the neckline for at least three days, preferably including a weekend. Then, it would be advisable to wait for the likely return move to retest the pattern’s integrity, with at least one long, red candle engulfing a green or small candle of either color.
Moderate traders may be content with a 2% neckline penetration below $159 and wait to see that the price remains below the neckline for at least two days.
Aggressive traders may short the stock now, counting on the downtrend line and symmetrical triangle’s confirmation with yesterday’s drop.
Trade Sample
- Entry: $175
- Stop-Loss: $180
- Risk: $5
- Target: $160
- Reward: $15
- Risk-Reward Ratio: 1:3
