Last week, Twitter (NYSE:TWTR) took on the leader of the free world and President Donald Trump was not taking it kindly. The social media company determined that a pair of presidential tweets about mail-in ballots being “substantially fraudulent” and “rigged” did not stand up to fact checking, labeling them misinformation and adding links to the actual facts. Days later, Twitter characterized Trump’s tweet about the unrest in Minnesota after George Floyd's death as “glorifying violence,” and appended a notice to it saying it was violating Twitter rules.
The president didn’t take what he considered as an infringement on his freedom of speech silently. He issued a presidential executive order to remake the Communication Decency Act so it would undo social media’s legal immunity from content posted by users.
Trump’s move is not likely to stand up in a court battle. However, it could lead to Twitter having to spend significantly more on managing the tweets on its platform, just when the San Francisco-based company's coffers are running low as advertising revenues have been drying up amid the pandemic.
Its quarterly sales for Q1 rose 3%, the smallest gain for Twitter on this metric in over two years. As well, from March 11 to the end of the quarter, sales plunged by a whopping 27% YoY, and this reoccurred in April.
So, is it time to sell—or even short—Twitter? Not necessarily. Let’s look at the chart, to gain some perspective.

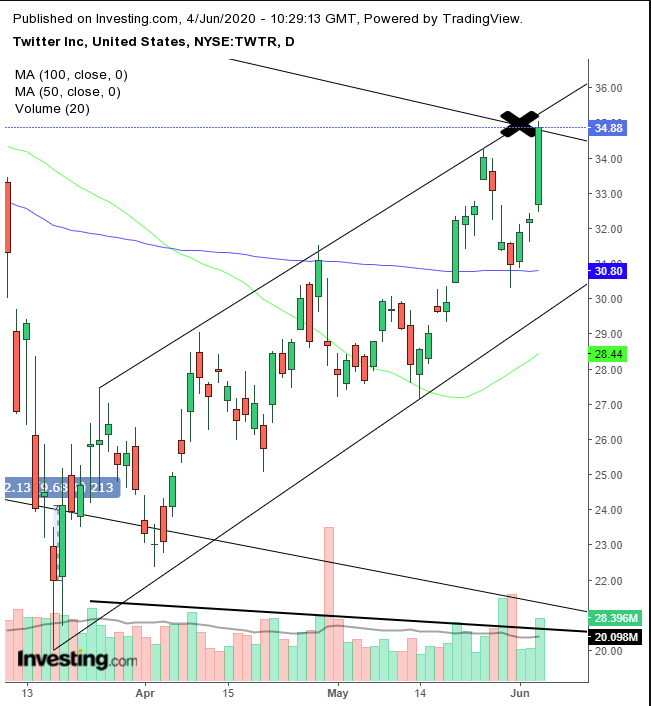
As can be seen on the chart, the price surged 8.1% yesterday, cutting through the 200 DMA. When a price moves the most since the March 19 dead cat bounce, which took shares higher by a percentage point, and the most in dollars since Feb. 6, it begs the question why did it to stop at this point specifically. Was it random?
Technical analysts will say probably not. Rather, it stopped when the price retreated from its session high, after it neared the top of its rising channel since the March low and the juncture of the top of the falling channel since September.
OK. So what does that mean going forward? All things being equal, a longer-term trend has more interest invested in it than a shorter-term trend does. Of course, there are such things as reversals, but going with the long-term puts a trade on the side of statistics.
Volume has been declining slightly amid the rising channel since March, but not in an obvious manner. It’s noteworthy that except for yesterday’s surge, prices spiked three times during the recent climb—all on negative days. Even yesterday’s somewhat more bullish volume was less than volume during those three days, by a long shot.
While volume is not obviously bearish, but to our way of thinking the resistance of the long-term falling channel and that of the top of the short-term rising channel primes the stock for at least a pullback toward the rising channel, if not for an outright end to the short-term uptrend.
Trading Strategies
Conservative traders do not trade against the trend. Therefore, they would go long if the price breaks through the ceiling of the long-term falling channel, or they'd short if it falls below the short-term rising channel.
Moderate traders may short after confirmation that the dual resistance by the converging trends holds a waiting supply.
Aggressive traders may short at will, providing they do so according to a plan that fits their budget and temperament.
Trade Sample – Aggressive Short Position
Entry: $35
Stop-Loss: $36
Risk: $1
Target: $30
Reward: $5
Risk:Reward Ratio: 1:5
Note: This is just just a sample, one that's suited for aggressive, disciplined traders, who understand that not every trade can win and not every trade is custom-tailored for every trader. It simply points out what to pay attention to. Feel free to change the components to suit your personal needs and timing.
