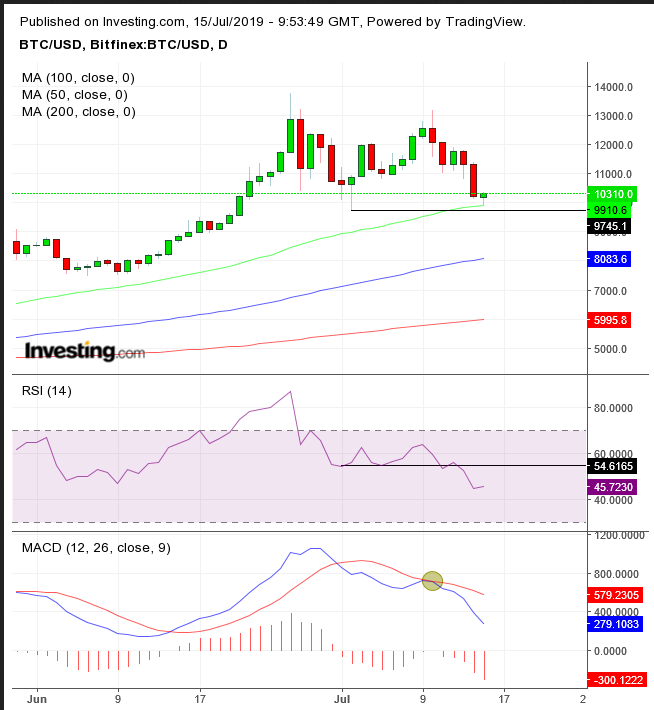
Did Bitcoin find its footing at the key $10,000 level, turning Trump’s criticism into a buying opportunity, or will it get worse for the digital currency before it gets better? The chart is mixed. Here’s what to look at for trading opportunities.
President Donald Trump said he was “not a fan” of cryptocurrencies, stating they “are not money, and whose value is highly volatile and based on thin air.” Trump's remarks followed Fed Chief Jerome Powell's criticism of Facebook’s Libra plans.
Bitcoin plunged 10% to $10,175, after briefly falling below the $10,000 psychological level. From a technical perspective, while the uptrend since the December 2018 bottom hasn’t ended, its endurance has been questioned, while a couple of indicators suggest prices could keep falling.

The first positive sign for Bitcoin is enough demand to support the $10,000 price level. There have been many analysts and investors who have referenced the psychological, round number as a red line. The 50 DMA matching up with the July lows reveal the level’s importance as a supply-demand pressure point.
While the peak and trough series is still within an upward formation, it has weakened recently. July’s inability to carry the trend higher than the previous, June 25, $13,764 peak revealed demand weakness. Another problem for the trend showed up when prices fell all the way back toward the July 2, $9,745 low. To be clear, as long as this level holds, the trend is still firmly up, but investors’ caution about the proximity of that low may become a self-fulfilling prophecy, forcing the price down to form that lower trough for a new downtrend.
The RSI provided a negative divergence, falling below its July low, while prices held above theirs. Given this is a momentum based indicator, it suggests prices may follow lower.
The MACD’s short MA found resistance below the longer MA, demonstrating that current prices are weak relative to longer prices, triggering a sell order. While, as opposed to the RSI, this is a lagging indicator, it may be sending a stronger signal right now. Given that – as opposed to the RSI – this is a lagging indicator, its current weakness partly reflects the previous rally, not the current drop, making this bearish behavior all the more alarming.
Trading Strategies
Conservative traders will wait till the trend establishes a trajectory with a clear path of a peaks and troughs in the same direction.
Moderate traders may short after the price falls below the July lows and finds resistance upon a return move, with at least one long red candle engulfing a green or small candle of either color.
Aggressive traders may go long on the proximity to the July 2, $9,745 low.
Trade Sample
- Entry: $10,245
- Stop-Loss: $9,745
- Risk: $500
- Target: $11,745
- Reward: $1,500
- Risk-Reward Ratio: 1:3
