Data released overnight shows that U.S. President Donald Trump’s tariffs have taken a significant bite out of both China's imports, which dropped 7.6% in December, and exports, which fell 4.4%, the worst results for both metrics since 2016, before the U.S. presidential election. Indeed, economic data from the world’s second largest economy has been consistently slowing.
During the final days of 2018, both China's private and official manufacturing metrics slipped into contraction territory. Investors, already jittery about the outlook for a global as well as American economic slowdown, dumped stocks and currencies tied to the Chinese economy, including the Australian dollar. Australia, China's largest trading partner, is directly impacted by its economic fortunes. As such the Aussie is often pressured when Chinese data disappoints.

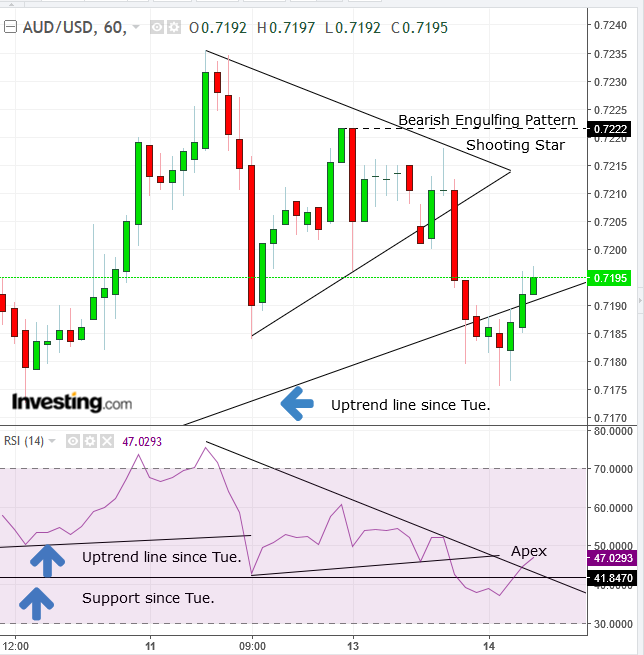
The AUD completed a symmetrical triangle, whose downside breakout demonstrated that bears ended the stalemate with the upper hand. As supply outpaced demand, sellers were forced to compromise on their asking price and seek willing buyers at lower levels.
The initial penetration included crossing below the uptrend line since Tuesday.
Note, the RSI showed that momentum mirrored price with the pause in the uptrend, although the consolidation of the RSI included a breakdown of the uptrend line, signaling that price will follow. And indeed it has, by breaking its own uptrend line.
Currently, the price is bouncing with a return move, to retest the shift in trends—a complex dynamic, which includes a combination of various forces, including a short squeeze, triggered longs and speculators joining for the ride.
At the time of writing, the price is retesting the downside of the failed uptrend line. Should the totality of the forces mentioned overcome the presumed supply by the broken uptrend line, the next test would be the triangle, with the shooting star confirming the resistance of the “double” bearish engulfing pattern (engulfed two green candles), at the cut off point for our bearish view, at 0.7222.
Note how the RSI is leading the price in retesting the momentum triangle’s apex, at around 50, the mid-level mark of the indicator, another gauge of equilibrium to mirror that of the triangle’s apex.
Trading Strategies – Short Position Setup
Conservative traders would wait for the price to fully retest the triangle, by reaching at least as high as the point of breakout at the 0.72 levels, then to post a trough lower than the 0.7175 hit at 1:00 EST.
Moderate traders might be content with a successful retest of the prior uptrend line, followed by a lower trough.
Aggressive traders are likely to risk a short on the first signs of resistance, such as a red candle following a green or small candle of either color, or a shooting star.
Trade Sample
- Entry: 0.7190
- Stop-loss: 0.7200
- Risk: 10 pips
- Target: 0.7160
- Reward: 30 pips
- Risk-Reward Ratio: 1:3
