Positive economic data out of New Zealand compared to inflation fears in the US means the New Zealand dollar has an advantage ahead of the Reserve Bank of New Zealand's interest rate decision on Wednesday.
New Zealand retail sales rose 2.5% in the first quarter, after falling 2.6% in the same quarter a year ago. Recreational goods added 16%, the highest category, showing optimism that a resurgent virus won’t stop people from outdoor activities.
This follows Thursday’s interview, in which New Zealand Deputy Prime Minister Grant Robertson—also the finance minister—said that his country’s economy has recovered “a lot better than expected,” and it was able to assist low-income earners during the pandemic while keeping its net debt in check.
Meanwhile the NZD/USD pair has been ranging since December. The next catalyst for the currency is the country's trade balance release, which will print on Wednesday morning locally followed later the same day by the RBNZ's interest rate decision, rate statement, press conference (all will occur late evening Tuesday in the US)—which will provide considerable rhetoric and clues as to the direction of the economy, as well as monetary policy.
From a technical perspective, however, it appears that positions have been building to short the kiwi vs the US dollar.

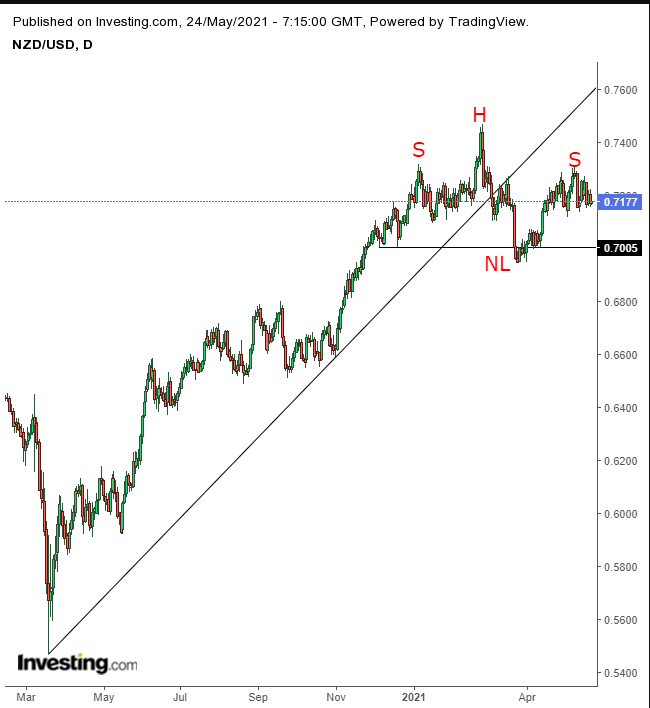
After peaking on Feb. 25, the NZD/USD pair has fallen below its uptrend line since the 2020 bottom, as it develops a H&S top. Let’s zoom in and take a closer look.

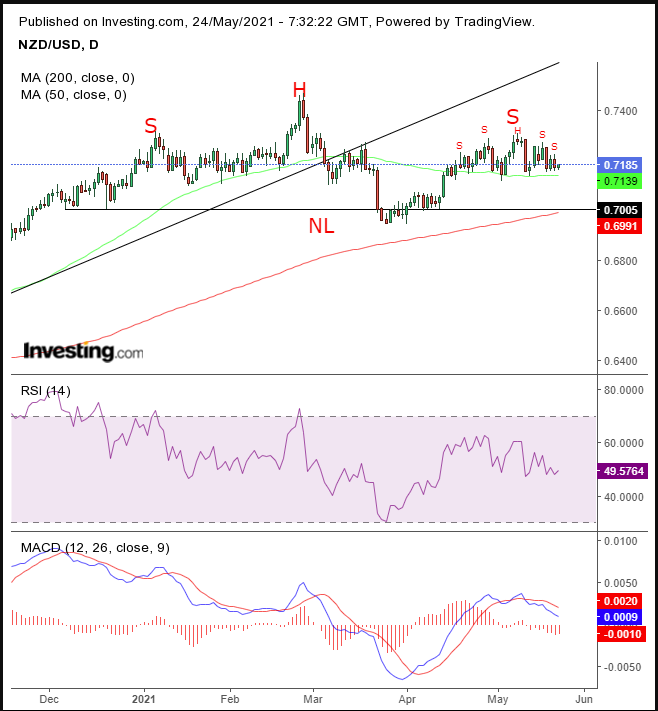
We can now notice a few important developments.
Both the RSI and MACD provided a negative divergence, while the price rose from the right shoulder to the head. Now they’re repeating this, both falling, while the price advanced in April-May, with the MACD providing a sell cross.
The 200 DMA furnishes support to the neckline of the H&S top since early December, while the 50 DMA is the natural neckline of a small H&S, making up the right shoulder. A completion of the small H&S could give the pair the momentum to break through the March fake-out-low, completing the top, whose implied target aims at the 0.6500 level.
If this plays out, it will also pull down the 50 DMA below the 200 DMA, triggering a Death Cross.
Trading Strategies
Conservative traders should wait for the price to register below the Mar. 25 low, then return, find resistance by the pattern and post even lower, establishing a conservative peak-trough downtrend.
Moderate traders would short after closing below the 50 DMA.
Aggressive traders could short at will, accepting the higher risk of failure as the price to pay for the higher reward of beating the market and trading with discipline according to a tight plan.
Here’s an example:
Trade Sample
- Entry: 0.7210
- Stop-Loss: 0.7310
- Risk: 100 pips
- Target: 0.6810
- Reward: 400 pips
- Risk-Reward Ratio: 1:4
Author's Note: This is just a sample. There are many ways to approach this trade, depending on your personal style. Until you learn how to customize your own trading plans, use ours for the purpose of learnings, not profit, or you’ll end up with neither. This is not a disclaimer. This is a guarantee.
