Breaking News
Get 45% Off 0
🌊 NVIDIA ripple effect: Track AI stocks' response to chip giant's earnings
Explore AI Stocks

Chart Of The Day: Tesla Shares May Have Reached A Bottom

By Investing.com (Pinchas Cohen)Stock MarketsMar 16, 2021 01:19
au.investing.com/analysis/chart-of-the-day-tesla-shares-may-have-reached-a-bottom-200454634
Chart Of The Day: Tesla Shares May Have Reached A Bottom
By Investing.com (Pinchas Cohen)   |  Mar 16, 2021 01:19
Saved. See Saved Items.
This article has already been saved in your Saved Items
 
 
TSLA
-3.96%
Add to/Remove from a Portfolio
Add to Watchlist
Add Position

Position added successfully to:

Please name your holdings portfolio
 
BTC/USD
-3.55%
Add to/Remove from a Portfolio
Add to Watchlist
Add Position

Position added successfully to:

Please name your holdings portfolio
 

Much has been written about the incredible rise of Tesla (NASDAQ:TSLA) stock. The reasons the electric vehicle maker's shares have skyrocketed are myriad and include: its status as a green initiative; the many technological applications of its business; and the charisma of its founder and CEO Elon Musk.

As well, we've noted previously that both Bitcoin and Tesla are assets favored by similar, young, non-traditional investors. That connection was reinforced recently when it was revealed that Tesla bought $1.5 billion worth of BTC during Q4 2020.

There's also growing interest from savvy institutional investors, though that cohort is still small. Nevertheless, Norges Bank, Norway's central bank, which oversees the world's largest sovereign wealth fund, revealed that it had bought shares in a number of EV stocks including Tesla during the fourth quarter. Of course, Norges also gained value from Bitcoin in the process.

By February, Tesla had made more money via the value of its Bitcoin holdings than it did on actual car sales. When the cryptocurrency hit $60,000 this past weekend, Tesla made over $1 billion.

In early March, we gave a bearish call on Tesla. We argued that the Palo Alto, California-based automaker was entering a take-profit correction, ahead of its shares once again continuing to rise.

We believe that phase is now over and Tesla's upward trajectory is about to continue.
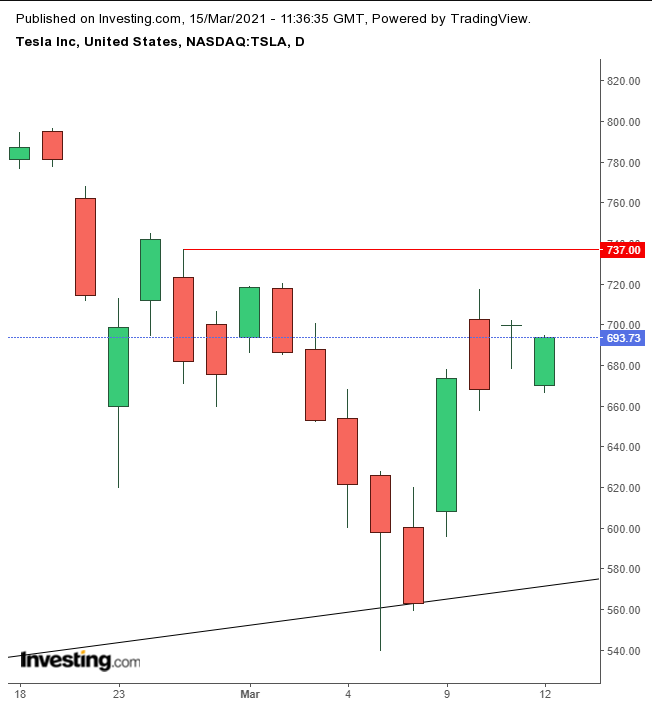
TSLA Daily
TSLA Daily

Tesla bounced off the uptrend line since June and may be about to complete a V-bottom. It is very difficult to trade off a V-bottom, because the bounce is so fast you can miss the trade. Also, it’s difficult to determine when the pattern is complete.

By considering the broader view, below, we'll be able to explain why we think the stock is about to complete a V-bottom.
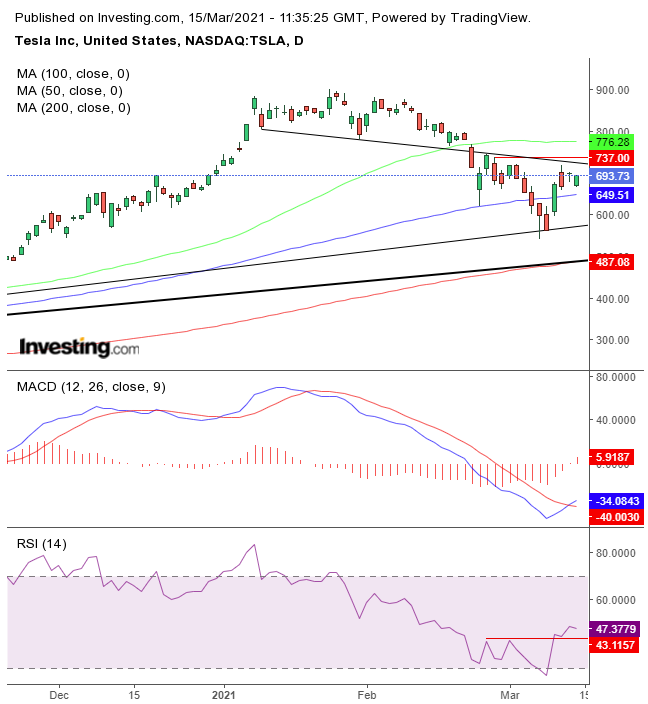
TSLA Daily, Broader View

The price has found resistance by the neckline of the H&S top. The chart could be viewed as a puzzle, which includes different technical pressure points. Sometimes they all come together to form a single, coherent picture, if you know how to recognize that.

The 200 DMA is aligned with the uptrend line since the March bottom. The price just overcame the 100 DMA; all it has left is to do the same to the 50 DMA, which would protect the previous record.

The RSI already completed its own bottom, showing that momentum is on the rise, and the MACD’s short MA crossed over the long MA, after having reached an oversold condition.

Therefore, if the price overcomes the $740 level, we’d expect it to take on the record—a closing price of $883.

Trading Strategies – Long Position Setup

Conservative traders should wait for the price to climb at least past $750, then return to establish a base above $720.

Moderate traders would go long after the price provides the same upside breakout and dips, as profit-taking and maybe shorting, for a better price, if not for evidence of support.

Aggressive traders could enter at will, provided they understand the entire post and accept the additional risk that comes with their search for higher profits, if they don’t wait for further confirmation. Money management is key.

Here’s an example of a basic but coherent trade:

Trade Sample

  • Entry: $750
  • Stop-Loss: $700
  • Risk: $50
  • Target: $900
  • Reward: $150
  • Risk:Reward Ratio: 1:3

Chart Of The Day: Tesla Shares May Have Reached A Bottom
 

Related Articles

Chart Of The Day: Tesla Shares May Have Reached A Bottom

Add a Comment

Comment Guidelines

We encourage you to use comments to engage with users, share your perspective and ask questions of authors and each other. However, in order to maintain the high level of discourse we’ve all come to value and expect, please keep the following criteria in mind: 

  • Enrich the conversation
  • Stay focused and on track. Only post material that’s relevant to the topic being discussed.
  • Be respectful. Even negative opinions can be framed positively and diplomatically.
  •  Use standard writing style. Include punctuation and upper and lower cases.
  • NOTE: Spam and/or promotional messages and links within a comment will be removed
  • Avoid profanity, slander or personal attacks directed at an author or another user.
  • Don’t Monopolize the Conversation. We appreciate passion and conviction, but we also believe strongly in giving everyone a chance to air their thoughts. Therefore, in addition to civil interaction, we expect commenters to offer their opinions succinctly and thoughtfully, but not so repeatedly that others are annoyed or offended. If we receive complaints about individuals who take over a thread or forum, we reserve the right to ban them from the site, without recourse.
  • Only English comments will be allowed.

Perpetrators of spam or abuse will be deleted from the site and prohibited from future registration at Investing.com’s discretion.

Write your thoughts here
 
Are you sure you want to delete this chart?
 
Post
Post also to:
 
Replace the attached chart with a new chart ?
1000
Your ability to comment is currently suspended due to negative user reports. Your status will be reviewed by our moderators.
Please wait a minute before you try to comment again.
Thanks for your comment. Please note that all comments are pending until approved by our moderators. It may therefore take some time before it appears on our website.
 
Are you sure you want to delete this chart?
 
Post
 
Replace the attached chart with a new chart ?
1000
Your ability to comment is currently suspended due to negative user reports. Your status will be reviewed by our moderators.
Please wait a minute before you try to comment again.
Add Chart to Comment
Confirm Block

Are you sure you want to block %USER_NAME%?

By doing so, you and %USER_NAME% will not be able to see any of each other's Investing.com's posts.

%USER_NAME% was successfully added to your Block List

Since you’ve just unblocked this person, you must wait 48 hours before renewing the block.

Report this comment

I feel that this comment is:

Comment flagged

Thank You!

Your report has been sent to our moderators for review
Continue with Apple
Continue with Google
or
Sign up with Email