HSBC Holdings (LON:HSBA), Europe’s largest bank, reported annual profits of $12.6 billion for full year 2018, falling short of the $13.7 billion estimate by 8%. Shares have plunged almost 4% in London today, as traders react to the results.
The banking giant attributed the disappointing profits to a reduction in business across the board: for trading, wealth management and retail banking since the spike in market volatility last year. It also cited the U.S.-China trade war as a factor in the profit-miss, with three-quarters of its operations in Asia, and said it considered Brexit an impending risk to future profits.
CEO John Flint described the fourth quarter of last year as "challenging," while the bank warned in its statement that "there are more risks to global economic growth than this time last year."
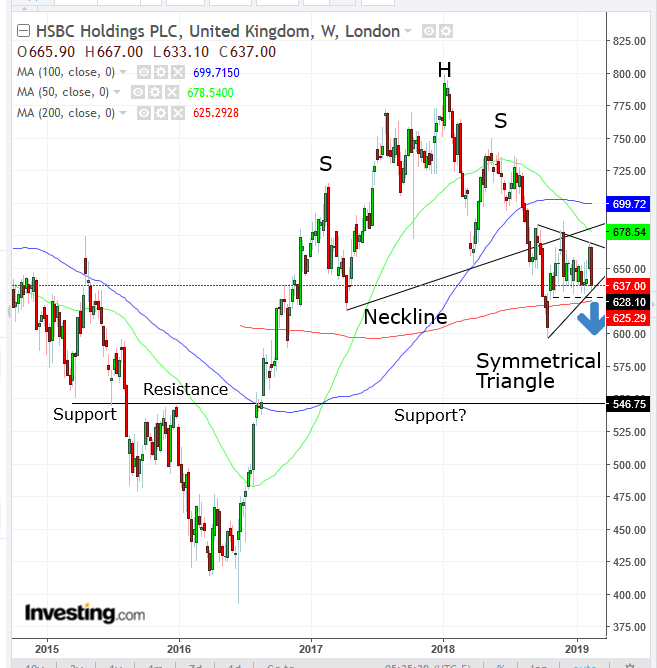
Looking at the chart, it's clear that the mega bank’s outlook is bleak both from a fundamental, but also from a technical perspective.

The stock completed a massive Head & Shoulders top ranging from February 2017- October 2018, whose downside breakout reached a substantial 10% penetration in late October.
While, it completed the H&S top, the 50-week MA fell below the 100-week MA, showing that prices over different ranges are falling into a downtrend. Also, the MAs mentioned are now providing resistance above the pattern’s neckline.
The breakout was followed by a return move that successfully tested the pattern’s resistance. Since then the price has been squeezed between the neckline and the 50-week and 100-week MAs topside and the 200-week MA downside. The range formed a symmetrical triangle, bearish in a downtrend, which this is, having fallen from the 800p levels of January 2018.
The symmetrical triangle, which is forming between the mentioned resistance and support, verifies them as well as attests to its own dynamic, in which the market is still unclear about the outlook. However, as a continuation pattern it’s biased to the downside, confirmed with the multiple resistance-breakdown of the 50-week and 100-week MAs and the neckline of the massive H&S top.
Note the symmetry of an impending downside breakout of the symmetrical triangle, to coincide with the 200-week MA, the last support till the 2015 highs at the mid-500p levels.
Trading Strategies – Short Position Setup
Conservative traders should wait for a decisive downside breakout of the symmetrical triangle, employing a minimum 3% penetration to reduce the risk of a bear trap, before committing to a short position. Then, they’d wait for a likely return move to retest the pattern’s integrity, with at least one long, red candle engulfing a red or small candle of either color.
Moderate traders may risk a short position with a 2% downside breakout, then wait for a return move for a better entry, if not for proof of trend.
Aggressive traders may be content with a close below the 628p level, falling to the lowest since Nov. 5 (dotted line).
Trade Sample
Entry: 628p
Stop-Loss: 643p
Risk: 15p
Target: 550p, round psychological number above 2015 highs
Reward: 78p
Risk-Reward Ratio: 1:5
