Global stocks paused today, after yesterday’s rally built on first quarter gains, the most since 2010. Also, U.S. futures edged lower earlier today, in the aftermath of the best quarter since Q2 2009, the bottom of the worst market crash in 70 years.
Several key factors have kept the S&P 500 buoyant for three straight months, including the Fed turning dovish, big earnings beats and hopes of a U.S.-China trade deal. And despite today's lull, we expect the climb to continue, at least for a while.
While we have stubbornly remained bearish, after predicting the current rally – amid the Christmas-eve rout – and that it would probably be the last upward correction within a resuming medium-term downtrend, we could change our view if the technicals signaled a different situation was developing on the SPX. Our red line is the September record-peak of 2,940.91, at which point we would convert to bulls.
Meanwhile, though we haven't changed our stance yet, we do expect the short-term rally to continue, retesting those highs.
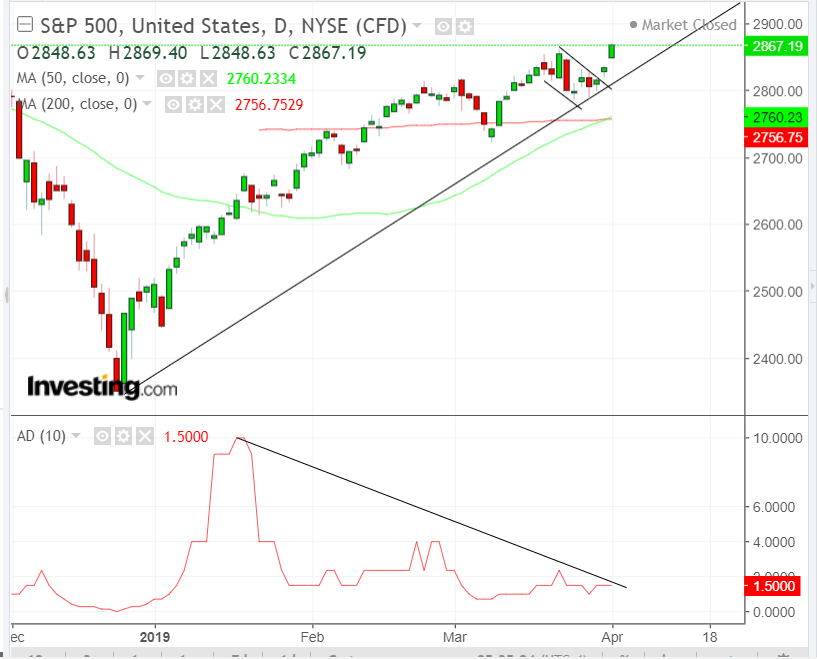
The price congestion with a downward bias from March 19 till March 28, was projecting that demand was slowly absorbing supply. Sales were presumably committed by the longs who enjoyed the 5% jump during the rally before the take-profit range, from March 8 to 19.
The upside breakout on Friday—when weekend commitments demonstrate confidence—happened as new bulls sought further supply at higher prices. The breakout signals to the old bulls who took profit that the rally is going to repeat, pulling them back in. The undecided who now recognize a trend are expected to join.
In technical analysis, it’s important to see the big picture by weighing the evidence. We look for other indicators to support our view, or if we’re honest enough, give us pause. The flag occurred precisely on the uptrend line since the December rout, the same time a golden cross triggered a buy signal.
Our most exciting realization, however, is that the flag’s target of a conservative 130 points—calculated by measuring the flag pole, the sharp move prior to the sideways move—coincides with the September high of 2,940.91, as the last piece of a jigsaw puzzle.
However, we are not yet comfortable enough to upgrade our bearish call. One example why is that the Advance/Decline line provides negative divergences when the breadth indicator failed to make a new high to mirror price. It has also been falling while the price has been climbing.
Nevertheless, we rely mostly on price action and we are therefore providing a short-term buy signal, again.
Trading Strategies
Conservative traders should wait for new highs to provide evidence that the short-term uptrend line undid the previous medium-term downtrend, reversing into both a short and medium-term uptrend.
Moderate traders may wait for a return-move to either ascertain the pattern’s integrity or for a better entry.
Aggressive traders may enter a long position now, or wait for a pullback for a better entry, according to their risk management.
Trade Sample
- Entry: 2,820, above the late-February, early-March, resistance-turned-to-support.
- Stop-Loss: 2,800, psychological round number
- Risk: 20
- Target: 2,880
- Reward: 30
- Risk-Reward Ratio: 1:3

