🥇 First rule of investing? Know when to save! Up to 55% off InvestingPro before BLACK FRIDAYCLAIM SALE

Chart Of The Day: Soybeans Set To Surge On China Demand, Hurricane Dorian

Published 05/09/2019, 10:21 pm
Updated 09/07/2023, 08:31 pm
ZS
-
ZC
-

The price of soybeans is about to jump as China finds itself out of options for sourcing the commodity other than once again importing them from the U.S. despite the trade war. Adding to price pressures, the path of Hurricane Dorian now threatens soy, corn and cotton fields in Georia and the Carolinas as it heads north.

In retaliation for U.S. tariffs levied on Chinese goods during the first round of trade hostilities in 2018, the Asian nation took its business elsewhere, importing the commodity—a key component of the national diet—from Brazil. However, with the South American supply thinning, China is now forced to resume importing soybeans from the U.S.

The technical chart clearly shows soybeans' transition from a depressed market into one that's about to break out.
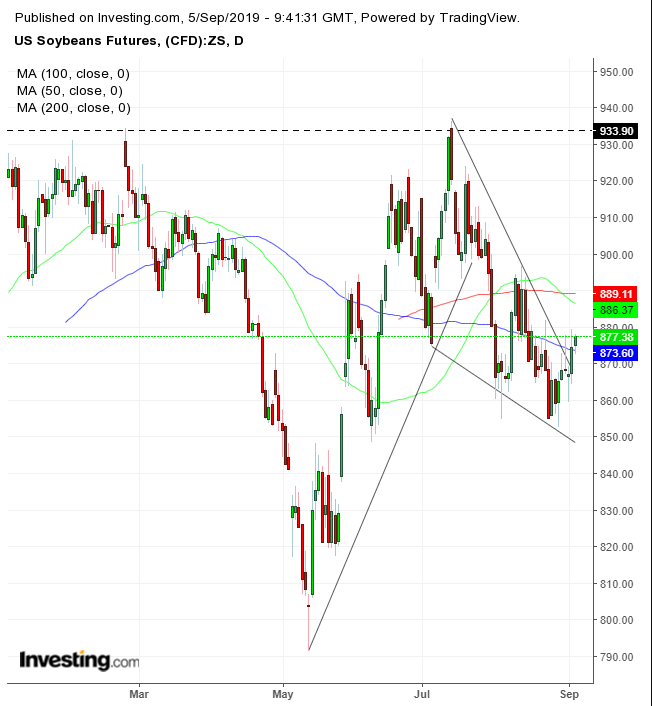
Soybeans Daily

Soybean futures broke to the topside of a falling wedge, bullish after a $130.50, or 16.20% rise in the two months between the low of May 13 and the high of July 15. The pattern dynamics resemble that of another continuation pattern, a flag or pennant.

The downward bias is presumed to be led by profit takers, and the upside breakout suggests that all supply is spent while demand hungers for more, forcing them to increase bids to seek out willing sellers at higher prices. This signals to market participants that the previous sharp rise is about to reoccur.

Moreover, if the upside breakout will take on the July 15 high of $936.38, the price would complete a much larger, much more serious—bottom—pattern.
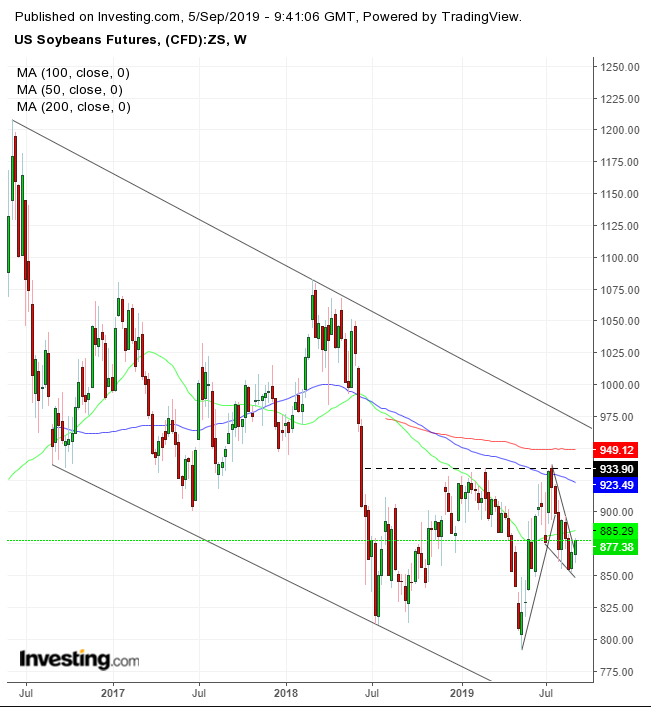
Soybeans Weekly 2016-2019

For over a year now, the price has been moving mostly sideways. An upside breakout of the July high would complete a bottom, threatening an upside breakout of a falling channel in place since June 2016, just before the UK Brexit vote. An upside breakout of that pattern would challenge the long-term downtrend since September 2012, from the height of just under $1,800.

Trading Strategies

Conservative traders would wait for the long-term bottom to complete before considering a long position.

Moderate traders may enter a long position after the price closes above the 200 DMA at $890 and retests the top of the pattern.

Aggressive traders could enter a long position at will, according to a trading plan that fits their account.

Trade Sample

  • Entry: $875
  • Stop-Loss: $870
  • Risk: $5
  • Target: $890, resistance of 200 DMA
  • Reward: $15
  • Risk:Reward Ratio: 1:3
  • Latest comments

    Loading next article…
    Risk Disclosure: Trading in financial instruments and/or cryptocurrencies involves high risks including the risk of losing some, or all, of your investment amount, and may not be suitable for all investors. Prices of cryptocurrencies are extremely volatile and may be affected by external factors such as financial, regulatory or political events. Trading on margin increases the financial risks.
    Before deciding to trade in financial instrument or cryptocurrencies you should be fully informed of the risks and costs associated with trading the financial markets, carefully consider your investment objectives, level of experience, and risk appetite, and seek professional advice where needed.
    Fusion Media would like to remind you that the data contained in this website is not necessarily real-time nor accurate. The data and prices on the website are not necessarily provided by any market or exchange, but may be provided by market makers, and so prices may not be accurate and may differ from the actual price at any given market, meaning prices are indicative and not appropriate for trading purposes. Fusion Media and any provider of the data contained in this website will not accept liability for any loss or damage as a result of your trading, or your reliance on the information contained within this website.
    It is prohibited to use, store, reproduce, display, modify, transmit or distribute the data contained in this website without the explicit prior written permission of Fusion Media and/or the data provider. All intellectual property rights are reserved by the providers and/or the exchange providing the data contained in this website.
    Fusion Media may be compensated by the advertisers that appear on the website, based on your interaction with the advertisements or advertisers.
    © 2007-2024 - Fusion Media Limited. All Rights Reserved.