We have been bearish on the US dollar for a long time. Now, the USD is gearing up to head lower, to the 90.00 target discussed}} in August.
This morning, though equity markets were buoyed by an apparent breakthrough that would ease US lawmakers’ objections to approving another round of fiscal relief, the COVID pandemic continues escalating, leading to a possible lockdown in New York City and a full national lockdown in Germany.
The news—both the good and bad—weighed on the dollar, whose decline continues, as its value comes into question as the odds of additional stimulus increase. Since the very purpose of the fiscal policy is to boost the money supply in the economy, it would, by definition reduce the value of the currency, encouraging spending and investing, as a way to restart the country's recovery which has been stalled by the ongoing coronavirus.
Still, increasing supply isn't the only reason that traders are dumping the greenback. The lowest US interest rate in history means the currency yields less as well.
Plus, as written about previously, according to Yale senior fellow and former Morgan Stanley Asia chair Stephen Roach, a “massive shift to fiscal stimulus is going to blow out the national savings rates and the current account deficit.” If Roach is correct, the dollar could plunge another 29% from its current level, to 63.
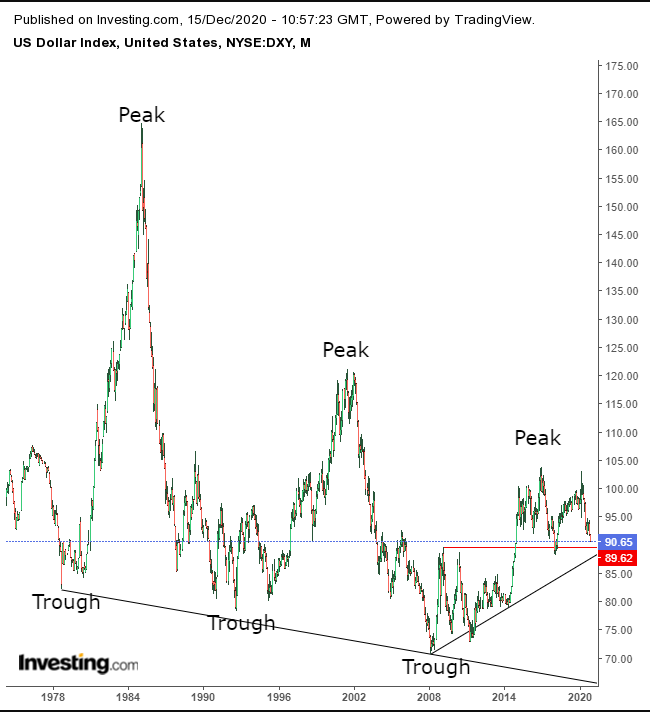
That would be the lowest point for the Dollar Index since 1973, when the Bretton Woods monetary system ended. At that time, the DXY was set at 100.00. Its current record low is 70.698, posted during March 2008.
Fundamentals aren't the only thing suggesting the dollar is headed lower. In the montly chart below, the macro downtrend is clearly visible, showing why our 90.00 target is also a crucial supply-demand crossroads that could signal a new record low.

The price is headed toward the nexus where the 2008 highs meet with the long-term uptrend line since the 2008 low.
For trading purposes, we'll look at the short-term next via the daily chart.

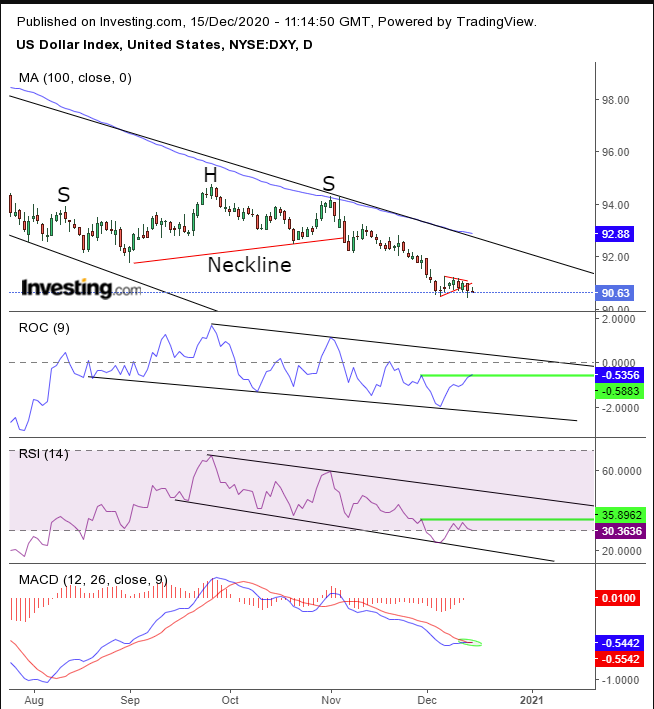
The dollar broke the bottom of a pennant—a period in which short sellers cash out, which means they must cover their shorts, or buy dollars, to return to their brokers.
That leg down within the downtrend, which has been framed within a falling channel, whose top is naturally drawn by the 100 DMA, has been signaled by the H&S continuation pattern we warned about {{art-200543600||in early November.
The next leg down is signaled by a pennant, a continuation pattern that develops following a fast move, which leaves traders breathless, exhilarated by fast profits but, at the same time, afraid to lose them. So they cash out while awaiting “further instructions,” to determine whether they’re just part of a mindless herd that could fall off a cliff, or whether there is more room to stampede.
The downside breakout occurs as, presumably, new bears short the rallies within the pennant, created by the earlier bears. These new participants are willing to increase their risk—by lowering their sell prices—till they find new available demand. That signals to the early bulls that it's time for a return to the fray, and they jump right back in to party on, in hopes of additional profits.
The falling indicators—for both price and momentum—are contemplating a rebound, reflecting the intense exchange that's occured during the pause in the downtrend. A decisive move down would force indicators to stretch their lower limits yet further.
Trading Strategies
Conservative traders should wait with a short for the price to close below the psychological 90.00 round number.
Moderate traders could risk a short if the price closes below the pennant’s lowest part, 90.62, posted Dec. 4.
Aggressive traders can short now, provided they work out their timing, budget and have a sensible plan in place.
Trade Sample
- Entry: 90.75
- Stop-Loss: 91.00
- Risk: 25 pips
- Target: 90.00
- Reward: 75 pips
- Risk:Reward Ratio: 1:3
