Negotiations surrounding the now 10-month-long, U.S.-Sino trade war took a significant step back yesterday after threats of additional tariffs tweeted by President Donald Trump threw a spanner in the works. Trump has been growing frustrated with China’s foot dragging as the Asian nation attempts to renegotiate better terms.
To show he means business, the president used the social media platform to announce that so far tariffs have created copious revenue for the U.S. He indicated that he's prepared to continue increasing tariffs from 10% to 25% on an additional group of goods.
China, unwilling to appear cowed, responded with its own reprisal, saying it might continue with the planned negotiations scheduled to take place in Washington D.C on Wednesday, but would cancel the inclusion of top negotiator Vice Premier Lui He. Asian markets traded in the red today and Chinese assets, including the yuan, sold off.

Chart powered by TradingView
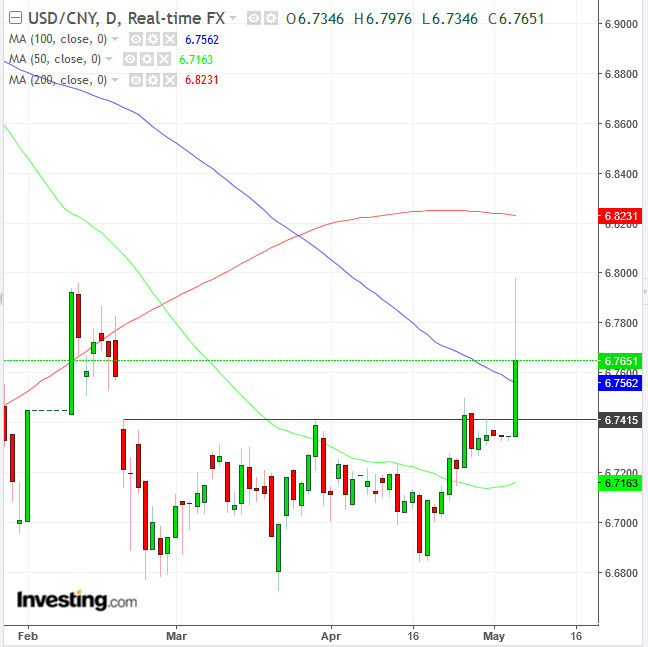
Last week, we noted that the price action of the USD/CNY pair suggested a triple bottom, though we couldn’t tell what might be driving the trading pattern. Looks like we've found our catalyst.
The dollar strengthened today, in general, due to its safe haven status. However, the sudden return of trade risk between the U.S. and China has affected China's currency, the yuan, the most. It opened 0.93% lower against the dollar.
The currency pared losses to 0.44%, but the damage may have already been done, since the move completed the triple bottom. The retreat from the 6.8000 levels may have been by dip buyers, as the price neared the 200 DMA for the first time since the pattern's formation in February. For now the pair has found support above the 100 DMA.
Trading Strategies
Conservative traders may wait for confirmation that the price remains above the neckline, employing a time-filter—to avoid a bull trap—such as a three-day period. They would then wait for a potential pullback to retest the neckline’s support, with at least one long, green candle engulfing a red or small candle of either color.
Moderate traders may do the same, employing a 2-day filter—to avoid being stopped out. They would then wait for the hoped-for return move for a better entry but not necessarily to retest the pattern’s integrity.
Aggressive traders may wait for a close above the neckline, satisfying a one-day filter, to increase the probability of a reversal.
Trade Sample
- Entry: 6.7600
- Stop-Loss: 6.7400, below the neckline’s support
- Risk: 200 pips
- Target: 6.8200
- Reward: 600 pips, to 200 DMA’s resistance, fitting into the technical puzzle of the pattern’s implied target, measuring its height.
