The Reserve Bank of New Zealand today reduced its benchmark interest rate for the first time since 2016 to 1.50% from 1.75%. The bank also signaled another potential cut to counteract slowing economic growth and disappointing inflation.
As the first central bank among the developed nations to cut rates this cycle, you’d expect a dramatic market response. However, after falling 1.03% against the U.S. dollar, dip buyers pushed the New Zealand dollar back up, to an insignificant loss of 0.08%.

Chart powered by TradingView
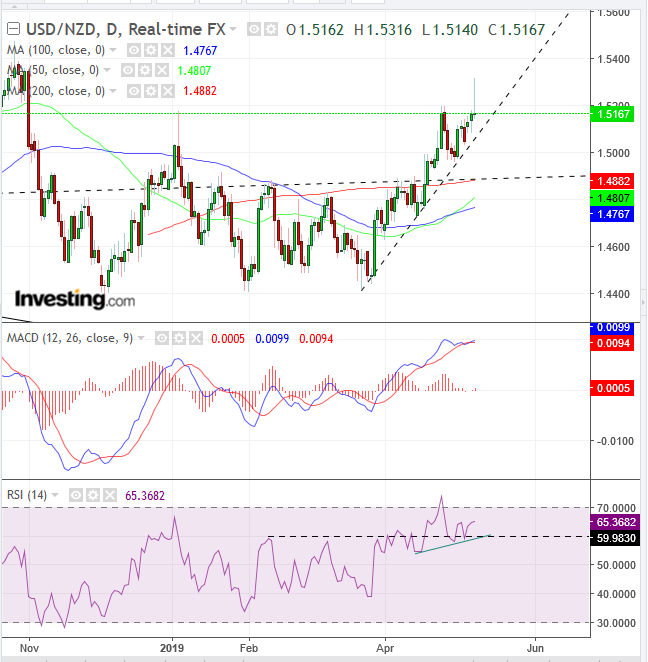
This led to the development – on an intraday basis - of an imperfect (due to its slight lower shadow) but potentially powerful shooting star, whose extremely long upper shadow could serve as a line with which to reel in unsuspecting buyers at what may prove to be unsustainably high prices.
However, the RSI is forming a H&S top, catching the eye of the observant trader, and prompting a deeper look. This closer examination reveals that after scaling above the 200 DMA, with the 50 DMA crossing over the 100 DMA and gaining on the 200 DMA for a potential golden cross, the pair is struggling against the neckline of a triple top, the Jan. 3 high of 1.5174, merely four pips.
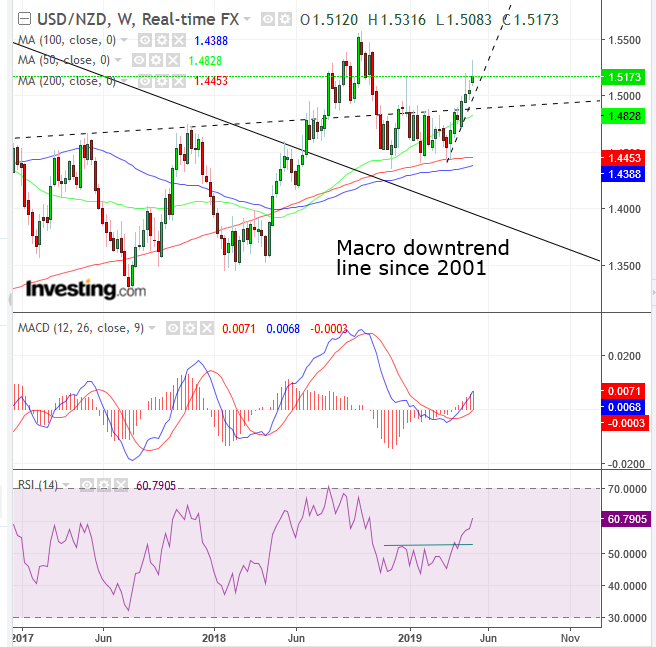
Moreover, taking a longer view, one sees an even more bullish picture for the U.S. dollar at the expense of the NZD.

Chart powered by TradingView
The pair crossed above the macro downtrend line since 2001, retested the 200 WMA and bounced, completing a bottom on a weekly closing prices basis – as seen in the weekly chart – and is now struggling against the January highs.
The MACD provided a buy signal and the RSI bottomed out.
To summarize, while we may expect a short term correction, the U.S. dollar is seen to gain against the NZD in the medium and long term.
Trading Strategies
Conservative traders would wait for another weekly high past the 1.5569 registered in October, to complete the minimum series of ascending peaks and troughs, establishing a medium to long term uptrend line.
Moderate traders may wait for a close above the January highs, with at least a 2% penetration to filter out a bull trap. Then, they’d wait for a return move to retest the bottom’s integrity, with at least one long, green candle engulfing a red or small candle of either color.
Aggressive traders may buy the dip to 1.5000, relying on the psychological number and short-term uptrend line.
Trade Sample:
- Entry: 1.5000
- Stop-Loss: 1.4880, 200 DMA
- Risk: 20 pips
- Target: 1.5300, round number below today’s high
- Reward: 300 pips
- Risk-Reward Ratio: 1:15
