While US homebuyers tightened their purse strings as unemployment exploded during the initial wave of the pandemic, homeowners took advantage of record low borrowing rates. Demand for home refinancing is up 107% year-on-year and in the latest week, and overall mortgage applications surged 5.1% week-on-week, in line with another major drop in mortgage rates, which have fallen by 63 basis points since late March.
So, we scoured mortgage lenders, whose business is booming, and found one that caught our eye: PennyMac (NYSE:PMT).

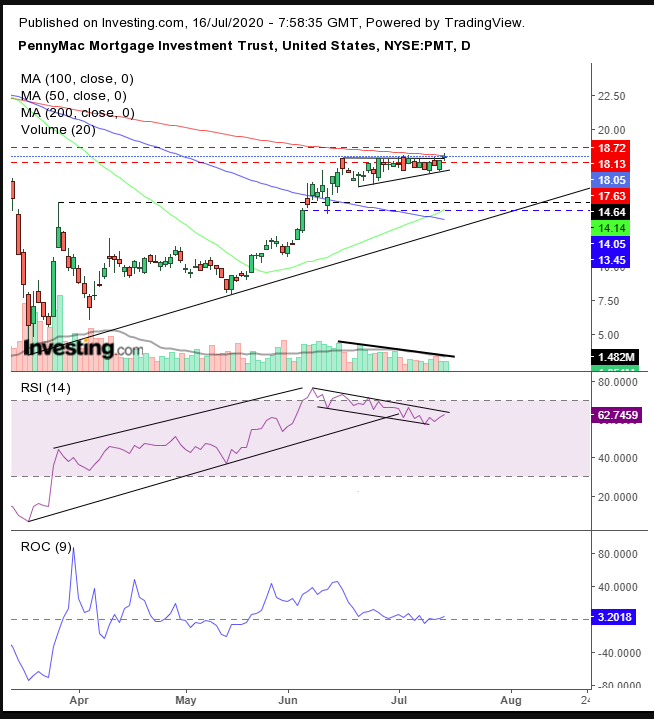
The stock’s price has been developing a potential flag. Truthfully, we prefer falling flags within an uptrend, as it suggests a dynamic in which tired bulls are taking profits and making room for new bulls to come in with fresh energy to take the stock another leg higher.
However, there are other technical patterns that have the same dynamics. Still, cautious traders should wait for a decisive upside breakout, to show demand has absorbed all available supply within the pattern and is not satisfied, enabling buyers to raise their prices to find new, willing sellers.
The price was forced to consolidate only after surpassing the Mar. 26 high of $14.64. The stock broke that resistance on June 5 with a breakaway gap, which provided support soon after, on June 11.
After a mind-boggling 124% surge in the two trading weeks that followed, bulls came to a full stop and took profit at the resistance point of the falling gap of Mar. 12, the significance of which is underlined with a red highlight, in the form of the 200 DMA. The 50 DMA crossed above the 100 DMA, as prices become increased.
The same 200 DMA alerts traders to the significance of the flag. Volume climbed along with the price, until pausing at the top of the flagpole, and has been in decline since then. RSI has been developed a falling flag of its own.
All these separate items show that the current pause in the price is not merely a random congestion, but probably the deep collective breath traders are taking before the next push.
Notice that while the price closed yesterday above the top of the range, the candle developed a small body, reflecting indecision due to the fact it closed below the 200 DMA. This was further confirmed by low volume, as the RSI didn’t break out either. The Rate of Change registered…well, no change.
Therefore, we await a decisive upside breakout to convince us that the move won't be just a random walk on the chart, but rather a concerted effort to increase positioning.
We’d like to see the price break through both the 200 DMA and the $18.72 resistance level of the Mar. 12 falling gap, supported too by a breakout in volume. Should such a move occur, we’d bet on another leg higher in the overall uptrend.
Trading Strategies
Conservative traders would wait on a long position for a close above $20, then wait for a pullback to retest the flag.
Moderate traders would be content with a close above the $18.72 top of the falling gap, then wait for a return-move for a better entry, if not for a retest of support.
Aggressive traders may go long upon a return to the bottom of the flag, or with a close above the 200 DMA.
Trade Sample
- Entry: $18
- Stop-Loss: $17
- Risk: $1
- Target: $22—conservative measure of flagpole
- Reward: $4
- RRR: 1:4
