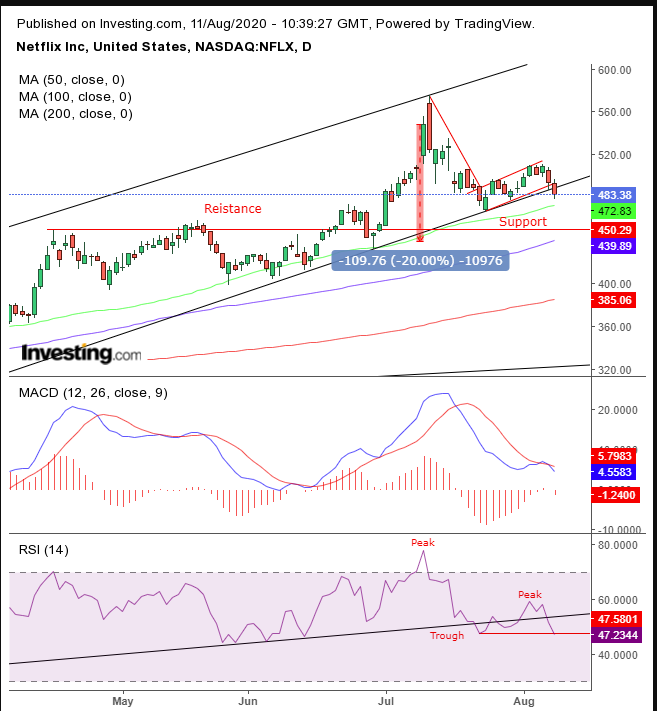
After its shares soared this year, gaining more than 60% and leaving the S&P 500's 3%+ YTD gain in the dust, Netflix (NASDAQ:NFLX) is overdue for a correction.
The Los Gatos, California-based, streaming entertainment provider's stock began skyrocketing well before coronavirus became a public health threat. The stay-at-home environment fostered by COVID-19 served only as a catalyst to spur business for the already thriving company.
Now, as the pandemic appears to be slowing in US and globally and investors anticipate that perhaps governments around the world will be easing social restrictions, the streaming giant's stock looks primed for a take-profit correction.
To be clear, we're bullish on Netflix over the long haul, even if the coronavirus threat ended tomorrow. We're confident the company will almost certainly increase its market position, which could mean it will even upend corded TV.
However, in the short- to medium-term, we’re betting on a selloff. Netflix has been strongly underperforming its FANG peers, falling the most among that cohort since May. And just recently it experienced its worst two-day slump since the March bottom.

On Friday the stock fell below its rising channel for the first time since the March low. At the same time, it completed a rising channel—bearish after the preceding fall, but especially so when that includes a downward penetration of its channel, which has been framing its unbelievable 91% surge from the bottom to the top.
The momentum-based RSI provided a heads up when it fell below its uptrend line—twice—during the same period, even as the flag developed. Its most recent drop below the uptrend line, its third time, coincided with the price, and is a hairbreadth away from completing its own peak-trough downtrend.
Beware of the presumed support area since the June 29 hammer. This broke the resistance that kept the stock depressed for two-and-a-half months, from April 16 through July 1. At worst, investors looking to recoup their bets by flipping their positions would support the price, in tandem with those still high on their breakout bet, and return the stock to its uptrend. At best, it may just push off the downfall for a while.
Either way, the $450 level is a position to be reckoned with and not to be considered as a trifle. If the price dips below $438, it will have entered a bear market, having fallen 20% from its July 10 record close of $548.73.
The moving averages underscore the major technical pressure points: the 50 DMA realigned with the channel bottom; the 100 DMA joined the $450 presumed support, and the 200 DMA is headed to the $400 support.
Trading Strategies
Conservative traders would wait for the price to bottom to join its long-term uptrend. The next major support would be the psychological, round number of $400, the February resistance, which from April through June turned into a support.
Moderate traders may short after the price penetrates the $450 support and then rallies on profit-taking.
Aggressive traders may short the flag’s completion when it coincides with the rising channel breakout.
Trade Sample – Aggressive Short
- Entry: $490 – upon a rally
- Stop-Loss: $500 – psychological round number
- Risk: $10
- Target: $450 – presumed support
- Reward: $40
- Risk:Reward Ratio: 1:4
