Oil prices are climbing for the second day after a Yemeni separatist attack on Saudi oil fields on Saturday added further tension to an already precarious Mideast environment.
At the same time, the U.S. decision to delay tariffs on some Chinese goods to December also boosted prices, while last week’s reports of stimulus from China, Germany and the EU had already begun to offset worries about diminishing demand.
Those are the known fundamentals, which, on their own, are difficult to gauge.
All we really have to go on is current market dynamics and their trajectories — which brings us to oil’s chart. And the technical patterns that are emerging aren't looking very positive for oil prices.

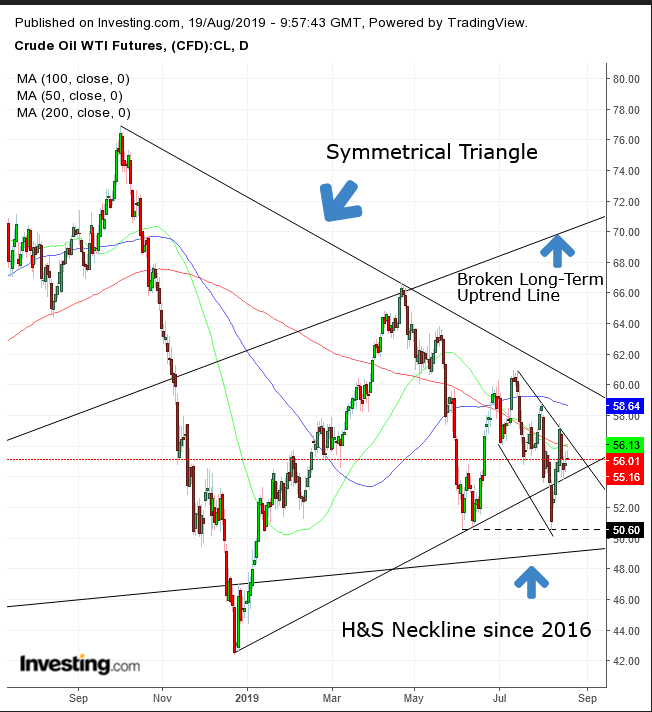
Oil has been trading within a large symmetrical triangle since October 2018. This pattern projects the lack of direction for the market, as both buyers and sellers advance.
While on the face of it that doesn’t help with a forecast, the fact that its development occurred as the price fell below its long-term uptrend line since the February 2016 bottom of $26.05 increases the probability of a downside breakout to the symmetrical triangle. The implied target — a $34 move — is the height of the pattern from the point of breakout, targeting the $20s.
That's a scary scenario for bulls, and is confirmed by another long-term pattern, a giant H&S top in the making since August 2016, which will be completed if prices fall below $50.
Also, the price is spiraling within a falling channel since July, which pushed it below the 200 DMA, and which is proving a resistance, as the price is trading on the lows of the day.
Some investors can’t imagine prices in the $20’s; but that's where they were only three and a half years ago, when there were no recessionary fears.
Trading Strategies – Short Position Setup
Conservative traders would wait for a close below the December low of $42.36 to extend the downtrend.
Moderate traders would also short if the price returns to the channel top and the 200 DMA at the $56 levels.
Aggressive traders could short at will, after creating a trading plan.
Trade Sample
- Entry: $55.50
- Stop-Loss: $56
- Risk: $0.5
- Target: $53.50
- Reward: $1.5
- Risk:Reward Ratio: 1:3
