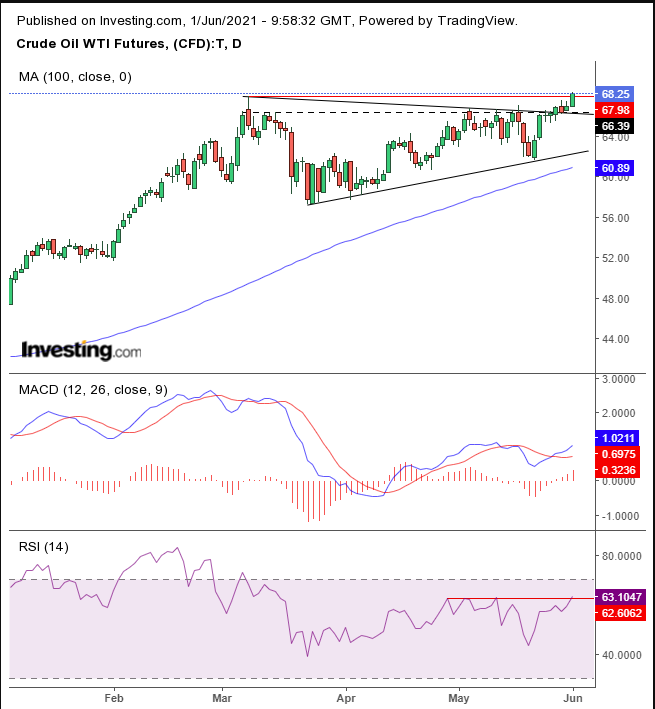
At the time of writing, oil is trading at $68.25 per barrel, just 6 cents below the session high. This is the highest since Oct. 22, 2018.
The commodity was boosted when the OPEC+ alliance predicted a tightening global market before today's meeting to discuss production quotas. The oil producing group thinks that as the economy in the US reopens, and with Europe planning to allow those who are vaccinated to travel freely within the EU, the oversupply of oil created during the coronavirus lockdowns will be used up and inventories will fall quickly in the second half of this year.
This could help the oil price to continue moving north. 
The recent price hike has seen the oil price complete one of two interpretive patterns. Whether it completed an ascending triangle or provided an upside breakout to a symmetrical triangle in an uptrend is academic. Note that both broke simultaneously. The practical implications are that the market created a mechanism that is set to push prices higher still.
The bullish prediction by OPEC+ motivated bulls, who may have overcome shorts at the top of a range going back nearly two months. As bears’ losses increase, they would have to cover shorts, contributing to demand by buying contracts to return to the broker. That is expected to push prices higher yet.
Finally, in addition to emboldening bulls already entrenched in positions, it is likely to attract speculators, who would give the commodity another push up.
The MACD’s short MA crossed above the long MA, a bullish cross. The RSI just peaked above its range, indicating a bottom in momentum.
Trading Strategies – Long Position Setup
Conservative traders should wait for the price to develop a full candle above the Mar. 8 high and a pullback to retest the latest support, before risking a long position.
Moderate traders would be content with a close above the previous high of Mar. 8 and a buying dip to commit to a long position.
Aggressive traders could risk a long position at will, provided they understand the heightened risk that corresponds to the potential higher reward of moving before the rest of the market. The higher the risk, the more imperative a coherent and tight trading plan to which the trader is committed becomes.
Here’s an example:
Trade Sample
- Entry: $68
- Stop-Loss: $66
- Risk: $2
- Target: $74
- Reward: $6
- Risk-Reward Ratio: 1:3
Note: This analysis is an interpretation of technical principles. First, technical analysis does not claim the power of prophecy. All it does is attempt to measure the forces of supply and demand and draws on its collective experience of the past and how a freely traded security tends to trend accordingly. So, even if we’re correct, the market may not follow through in the way it normally does. Second, our interpretation could be wrong. Finally, this trade sample is just a sample. You need to develop your own style, based on your needs, which would include your timing, budget and temperament. Until you learn how to develop that knowledge, you’re welcome to use our samples, for learning, not profit. Or you’ll end up with neither. Guaranteed, nor your money back. Happy Trading!
