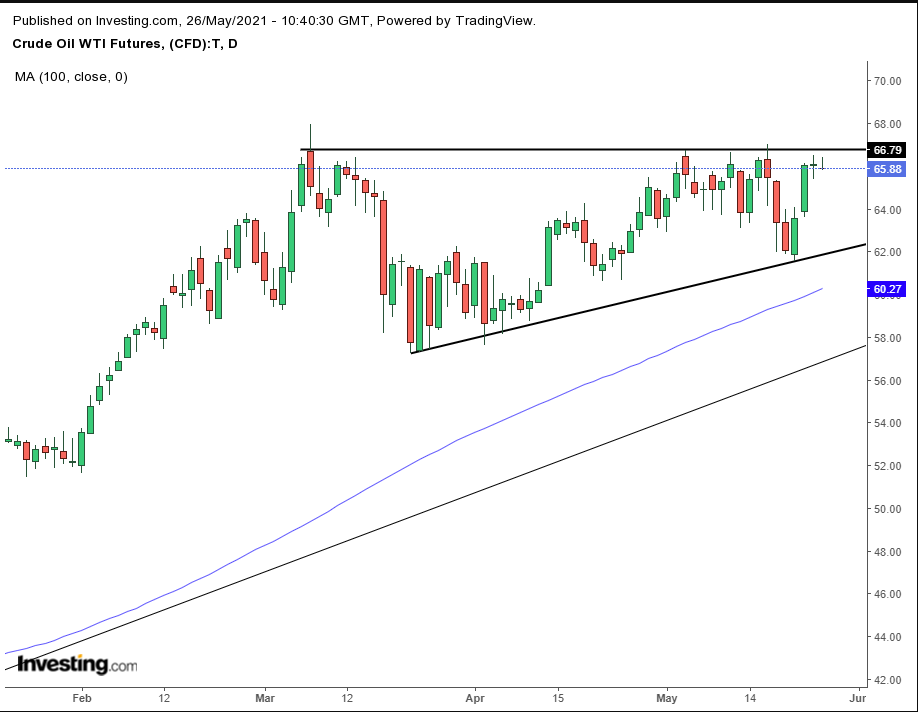
Oil prices have been hitting a ceiling at the $66 level. That's where it’s trading now, slightly below the highest levels for the commoditiy since October 2018, when prices peaked just under $77.
There are currently two primary narratives providing conflicting forces that could drive the price of oil out of its current range—in one direction or the other depending on the level of demand for oil, or lack thereof.
The "Demand Narrative" notes that since the June-July WTI time-spread, called the prompt cash roll, traded on Tuesday at 20 cents a barrel—the highest since May 2020—demand at the US's major crude oil storage hub in Cushing, Oklahoma could increase since that metric is considered a leading indicator of the pressures on supply and demand.
That strength corresponds to the surge in commodity prices, bolstering the opinion of some investors who believe that energy prices are set to soar too. As well, demand pressure could escalate as the upcoming, post-COVID summer driving season approaches, which could be more robust than usual after the pandemic kept travelers and vacationers at home throughout the past year.
Conversely, the "Supply Argument" posits that the pent-up demand described above, could be offset by soon to be released Iranian oil supply, which till now has been off the market. The Middle Eastern oil producer has been negotiating with the US about reviving the Obama-era 2015 nuclear deal and removing sanctions placed on them by President Donald Trump’s administration which has kept Iranion oil off the market...at least officially.
An additional challenge to oil prices recapturing the highs of previous years: President Joseph Biden's green agenda which could move energy usage away from oil.
These conflicting 'agendas' are even projected on the technical chart via WTI's range since March.

The price of oil has weakened as it reached the top of the range, below $67, where supply has been outstripping demand ever since prices returned from -$40 levels during April 2020 when they briefly went subzero.
However, take a look at demand within the range. As opposed to supply, which has been fixed, demand has been rising from $57-$58, to the mid $60s and finally to the upper half of the $61 level. If this trend, in which demand rises against fixed supply, continues, buyers are on course to overwhelm sellers, pushing prices above the bullish pattern.
This completion will probably trigger a series of events that would help the price explode higher. Short covers and triggered longs will attract speculators, which would presumably push prices even higher.
Trading Strategies
Conservative traders should wait for the price to complete the pattern, which will likely find resistance at the $70 round number figure, as short sellers finish covering, triggering a return-move, to retest the pattern’s integrity.
Moderate traders would wait for the same pullback for a better entry, if not for further confirmation of support.
Aggressive traders could enter a contrarian short position now, given that the price is at the very top of the range, providing an ideal entry from a risk-reward perspective. However, because this would be an aggressive move, against the prevailing trend, a tight trading plan is that much more important.
Here’s an example:
Trade Sample – Contrarian Short Position
- Entry: $66.50
- Stop-Loss: $67
- Risk: $0.50
- Target: $63
- Reward: $3.50
- Risk:Reward Ratio: 1:7
Author's Note: This is a risky trade. We don’t know that prices will fall, but the price weakening at the top of the range increases that probability, and the risk-reward ratio is exceptional.
Also, notice that this is a trade “sample,” indicating it isn’t the one correct way to approach this trade. You need to develop your own customized trading plans that incorporate your timing, budget and temperament. Until you do, you’re welcome to use ours, for learning purposes, not profit, or you’ll surely end up with neither. Happy trading!
