Crude oil is under significant pressure, as multiple risks threaten the continuing global economic expansion. Obvious culprits include the Turkish economic crisis and ongoing trade war.
The former has already taken a toll on European banks; however, this is likely a short term issue since exposure was low. The latter hazard could be more permanent since it threatens to end economic growth, which is already expected to slow as the business cycle concludes.
This outlook for a global economic slowdown has discouraged oil demand, which yesterday was signaled very clearly when US inventories hit a 17-month high.

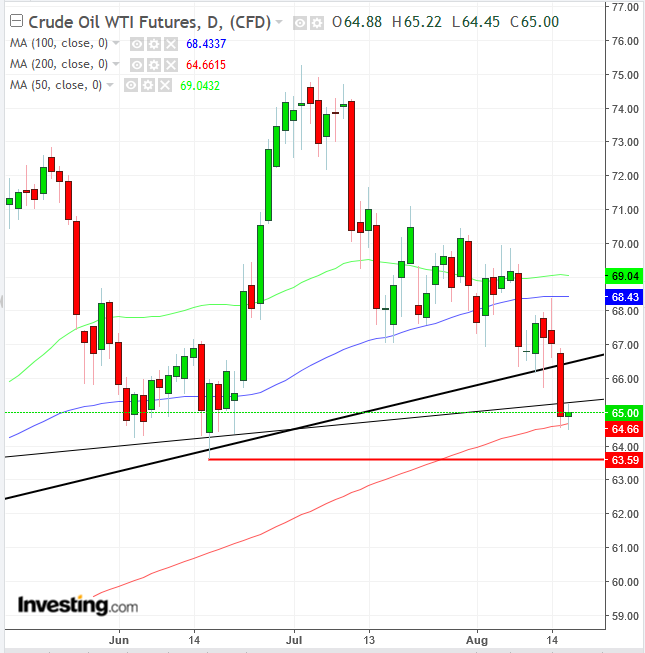
The commodity's price fell on the news, below the uptrend line since November 14, 2017, after failing to scale above the 100 DMA on Tuesday. However, the price rebounded after slightly dipping below the 200 DMA.
As such, the price may be trapped between the $68.5, 100 DMA and the $64.50, 200 DMA. The contract would signal a reversal if it registered a peak lower than $63.59, the level posted on June 18 (horizontal, thick red line).

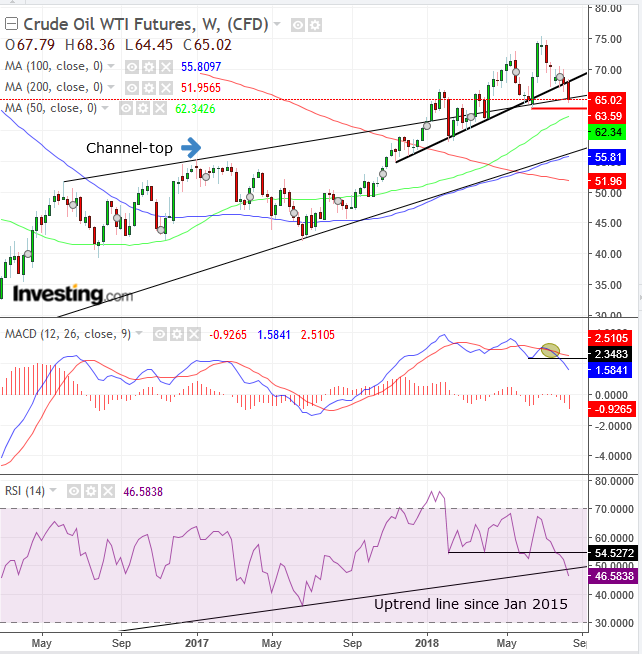
Notice on the weekly chart, above, that the 50 WMA (green) supports the previous trough, as the 100 WMA (blue) perfectly moves alongside the long-term uptrend line since the February 2016 bottom.
The rising channel top since mid-2016 turned from resistance to support. Note too that alongside this, the midterm uptrend line since November 2017 started. Price violated the long-term channel top’s support together with that of the midterm uptrend line.
The MACD provided a sell signal when the short MA (blue) tested the long MA (red), only to fall lower (see the ellipse). In addition, the RSI fell below its support since February 5. Moreover, for the first time since January 2015 the momentum indicator fell below its uptrend line.
These signals increase the probability of the price following suit, crossing below the June trough of $63.59 for a midterm reversal. The next test would be the long-term uptrend line, between $55 and $60.
Trading Strategies
Conservative traders would wait for the price to post a lower trough, followed by a return move to successfully retest the support-turned-resistance of the violated trough, as market psychology flips.
Moderate traders may wait for the return move to provide a better entry, but not necessarily for proof of reversal.
Aggressive traders may enter a short position after falling 1 percent below the $63.59 trough, below $63.00 a barrel, to avoid a bear trap; alternatively, they could short upon a bounce to the 100 DMA at the $68.50 level.
