WTI crude retreated for an hour after yesterday’s EIA data confirmed a sizeable swelling in inventory levels to near-record highs. Crude stocks grew by 5.7 million barrels in the week ending Jul 3, trouncing estimates for a decline of 3.114 million barrels.
However, after the initial decline, the price then surged by more than a full percent, more than wiping out those early losses. Since then, oil has ticked lower to virtually unwind all of those post-EIA gains.
There continues to be significant uncertainty in the oil markets as the world recovers from the coronavirus pandemic. It is still unclear how the demand recovery will look or when it may be fully restored. Production shows signs of increasing in the near future, but there are a few forces holding it back. Refinery and pipeline issues, especially in the US, add to the uncertainties.
So, where do we see oil going from here? Technicals can provide a clue.

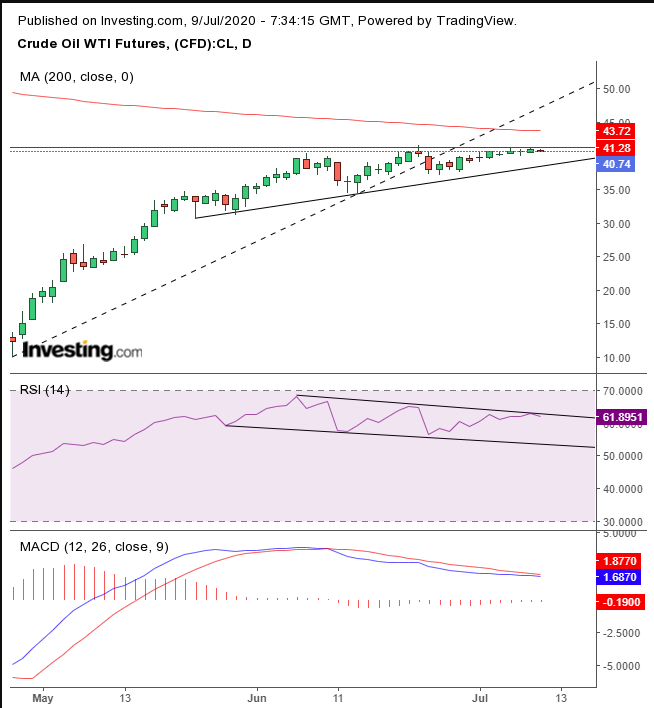
After seemingly rising from the dead, when it fell by as much as $40 below zero for the first time ever, the price of oil has been unable to convincingly clear the +$40 level. It has been hovering around there for over a month. And while the price has been clawing higher, it remains stuck below $42.
That level is not random. It is the top of a falling gap that formed when the price collapsed on Mar. 9, plunging a mind boggling 25%. A falling gap—especially one of this size—leaves an impression on traumatized bulls, as well as an equally strong, happy memory for the lucky bears. That dynamic creates resistance, as we have seen now for more than a month.
Even as bulls have dug in their heels and stubbornly marched on, both the RSI and MACD have been providing negative divergences, leaving the price on its own, without the backup of momentum or a positive technical outlook, when comparing different price gauges. Also, the price has been inching towards the 200 DMA, which may be weighing on bulls’ minds.
While the price has fallen below the uptrend line in place since the Apr. 28 low, the first low after oil broke above zero, WTI is still in an uptrend, with rising peaks and troughs. What we are looking at is a weakening of this uptrend, which does not involve a reversal.
Trading Strategies
Conservative traders would either wait for a clear break of the month-long stagnation, with the price conquering the 200 DMA and the MACD and RSI leveling out, or for a bonafide reversal with falling peaks and troughs.
Moderate traders might go long upon a return to the recent uptrend line in place since May 22, at around $39 at the current angle, or with a long, green candle.
Aggressive traders would short upon a downside breakout, or even from current levels, and rely on resistance from the falling gap.
Trade Sample – Aggressive Short
- Entry: $41
- Stop-Loss: $41.66 – above June 23 intraday high – the highest since the falling gap
- Risk: $0.66
- Target: $39 – trend line since May 22
- Reward: $2
- Risk-Reward Ratio: 1:3
