WTI dropped for the third day amid rising U.S. stockpiles, compounded by dwindling demand from refineries. This surprise inventory build is threatening to end WTI's uptrend—last week, inventories rose to the highest since July 2017, according to the Energy Information Administration.
Fundamentally, the outlook for the oil market is complex. Even if Saudi Arabia breaks its “wait-and-see” approach and errs on the side of tightening to avoid last year’s price drop, a brewing trade war is threatening a global slowdown and with it, demand for energy.
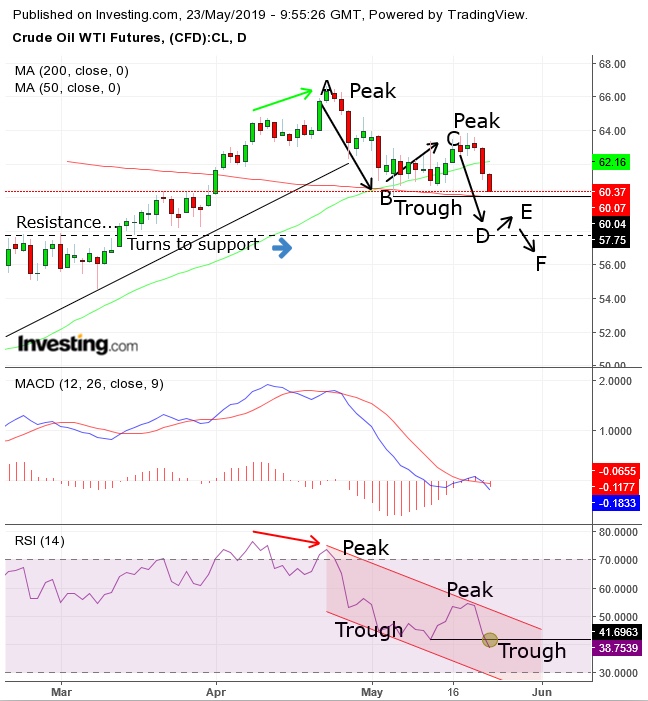
As the chart below shows, several signs are now pointing to an imminent medium-term downtrend, suggesting it may be time for a short call on black gold. WTI is down 1.7% at $60.69 today.

From a technical perspective, oil is still in a medium-term uptrend despite this month’s 5.6% drop, or the 9% fall from the April 23 high. The direction of peaks and troughs determine the trend, and those have not reversed from the uptrend.
However, prices are reaching a red line: edging toward posting the second lower trough to complete a medium-term downtrend formation, if they fall below the $60.04, May 6 low. Right below that lies the $60 level, the psychological round number. The price has already registered the two required peaks within a descending trend, the April 23 and May 20 highs.
Early in the month, the 50 DMA crossed the 200 DMA, triggering a golden cross, which is a bullish trigger. However, the current fall below the 50 DMA may have watered down the positive outlook.
The MACD attempted an advance, but the shorter MA fell back below the longer MA, only underlying the weakness in prices seen across various gauges.
The RSI has already posted that second, lower trough, on an intraday basis. Wait for the close to ascertain whether the momentum indicator truly completed a descending peak-trough formation, which would suggest that prices will follow with their own falling trend. The RSI gave observant traders a heads up when it fell against rising prices, April 8 to April 23, thereby providing a negative divergence signal.
It should be noted that there is a stricter interpretation of peak-trough analysis, which is for the price to develop a descending peak-trough formation, independent of the previous uptrend. That would require another peak (marked with an E in the chart) and another trough (marked by F in the chart), which would be the signal for a complete peak-tough downtrend. While the stricter interpretation makes for a stronger argument for a continued decline, it's at the cost of missing some of the move.
Trading Strategies
Conservative traders would wait for prices to complete a descending series of peaks and trough, independent of the previous uptrend, as marked by E and F.
Moderate traders may rely on the more lenient peak-trough interpretation, with 3% penetration as a filter to avoid a bear trap, followed by a pullback to retest the $60 levels, the previous lows and 200 DMA.
Aggressive traders may be content with a close below $50.50, to satisfy a minimum 1.00% filter, reducing the chances of a bear trap. They could wait for a potential pullback for a better entry.
Trade Sample
- Entry: $59.50, after satisfying a 1.00 filter
- Stop-Loss: $60.00, psychological round number
- Risk: $0.50
- Target: $58, resistance-turned-resistance level, March, April
- Reward: $1.50
- Risk-Reward Ratio: 1:3
