JPMorgan Chase (NYSE:JPM) is expected to report Q1 earnings on Friday before the market opens. Consensus is for EPS of $2.36 on revenue of $28.47 billion.
The bank had beaten expectations in all earnings reports for three straight years up to last quarter, in which it missed both. Was that the beginning of a downtrend, or just a fluke, or correction, after an extended period of better-than-expected results?
Shares yesterday closed down 0.7% at $104.87, after having gained 8.3% since the beginning of the year. As the technicals demonstrate, the stock is perched on a knife's edge. Here's what its chart is signaling about the possible direction it could take next.

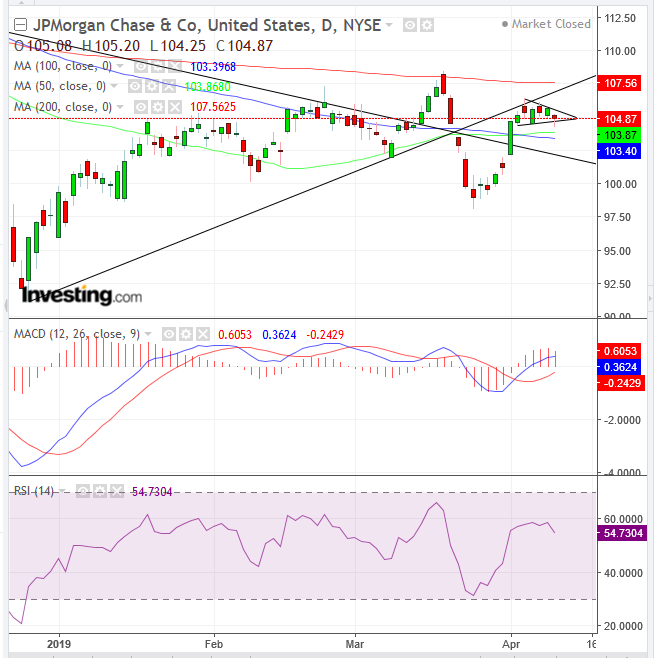
Unlike our bearish outlook for Wells Fargo (NYSE:WFC), whose short-term, medium-term and long-term picture all seem bleak, signs are mixed for JPM—it's hovering between a potentially bullish short-term and bearish medium- to long-term. Whereas WFC’s pennant is bearish after the 8.3% drop in just 4 days (March 10-March 22), upon a downside breakout, JPM’s pennant is bullish after its 8.43% rally in just 8 days (March 25-April 3).
JPMorgan Chase fell below its uptrend line since the December rout, similar to WFC; unlike Wells Fargo, it broke out of its long-term downtrend line since 2018. Like Wells Fargo, JPMorgan Chase found resistance at the late September 200 DMA (WFC, Sept. 20, JPM, Sept. 19). Unlike WFC, JPM scaled above its 50 and 100 DMAs. Like WFC, JPM’s RSI posted a lower trough, clearing the path for falling momentum, but its MACD looks stronger, where the shorter MA is above the longer MA.
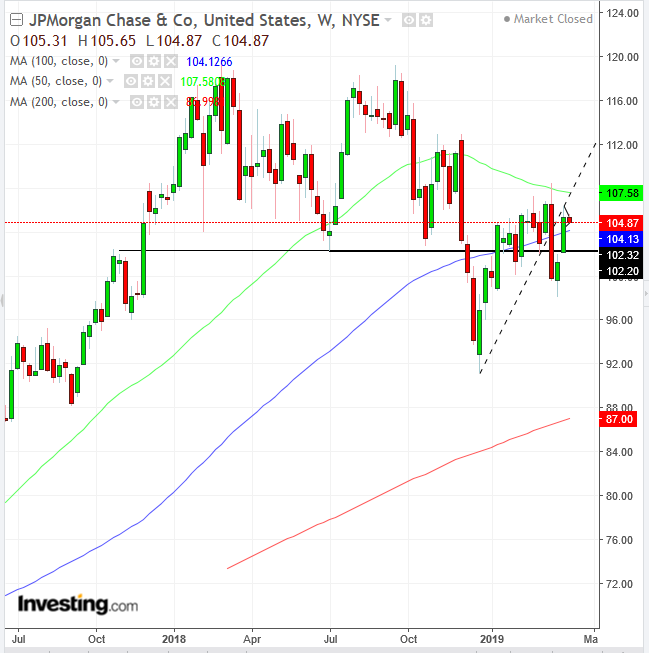
However, the biggest conflict for JPM is between the bullish pennant – complete with an upside breakout – and a very bearish double-top seen on the weekly chart.

The price completed a double top, when falling before the trough between the two peaks. While the price did manage to climb back above the neckline, the resistance below the short-term uptrend line (dotted line) and 50-week MA increases the potential that crossing the line does not change the double-top’s bearish implication.
Therefore, a decisive breakout of the daily chart’s flag will determine the next major move. An upside penetration would indicate a double-top failure, stepping over the stop-losses and creating a massive short squeeze, catapulting prices higher. On the other hand, a failure for the bearish pennant would vindicate the weekly double-top pattern.
Trading Strategies
Conservative traders would wait for an obvious resolution to the trend conflict, with the stock either posting a higher peak above the March 19, $108.40 high, or a fresh trough below the March 25, $98.09 low.
Moderate traders are likely to wait for a decisive pattern breakout on a closing basis, then wait for the return move to demonstrate pattern integrity, as the price finds support on an upside breakout or resistance if prices fall out of the bottom of the pattern.
Aggressive traders may go with the breakout, preferably on a closing basis.
Trade Sample – Long Position
- Entry: $106
- Stop-Loss: $105
- Risk: $1
- Target: $109
- Reward: $3
- Risk-Reward Ratio 1:3
Trade Sample-Short Position
- Entry: $104
- Stop-Loss: $105
- Risk: $1
- Target: $101
- Reward: $3
- Risk-Reward Ratio: 1:3
