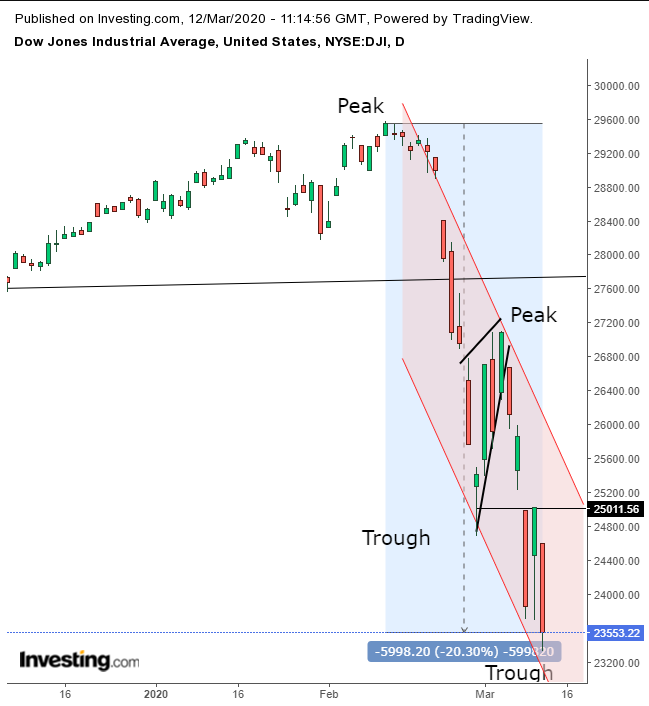
The Dow Jones Industrial Average dropped yesterday, completing a 20.30% decline at the close, from its closing peak of 29,551.42 on Feb. 12. That put the mega-cap index officially into a bear market.
Of perhaps even greater note, yesterday's close also ended the Dow's 11-year bull market, the longest bull run on record. Investors most likely won't be seeing those kind of numbers again for years.
On average, bear markets last less than a year, whereas bull markets play out over about 2 and two-thirds years. Meaning, on average, it will take at least another three and-a-half years for the next bull market to occur. Which doesn’t necessarily mean the blue-chip index will head back to record levels. For comparison, between the all-time high the Dow hit on October 2007, to when it bested that level during March 2013, five and-a-half years elapsed.
And that didn't follow the the longest bull market on record. According to the old adage, the bigger they are the harder they fall. Would that apply to stock market cycles as well?
Could be. The previous longest bull market ended with the 2000 crash, and it took the Dow Jones Industrial Average almost seven years to return those same highs.

Yesterday the Dow also completed a downtrend, when, at the close it posted a second, lower trough, establishing the required two descending peaks and two troughs to officially be considered a downtrend. So, from both a fundamental and technical perspecitve we now have a market that's expected to continue heading downward.
Once in a bear market, downtrend rallies are presumed to be temporary corrections, while selloffs are considered to be the main moves, within a contiguous downward slump. That’s why the moves lower in a bear market are much bigger than the upward moves. Selloffs continue as more-and-more investors become increasingly disillusioned with their ability to draw profits, after preceding rallies fall short of expectations.
This bear market isn't a surprise, based on technical analysis it was predicted.
Last year we also warned of a long-term bearish pattern. However, we abandoned that view after the index broke to its top side. It turns out now, the pattern remained valid and the topside breakout was just another symptom of how unhealthy the aging bull was becoming as the U.S. Federal Reserve tried to keep it propped up.
Trading Strategies
Truly conservative traders would now stay away from equities till a new bull market begins. However, we use the term in this context relative to active, not passive, traders.
Conservative traders would wait to short, anticipating the price to retest the bearish flag and as they seek proof of resistance, such as a long, red candle engulfing a previous green or small candle of any color.
Moderate traders may short on a return move, but not necessarily wait for trend verification but rather, for an entry closer to resistance, limiting exposure.
Aggressive traders may short when the price returns to the psychological 25,000 mark, which proved a support-resistance even amid these recent, crazy trading days.
Trade Sample
- Entry: 25,000
- Stop-Loss: 26,000
- Risk: 1,000 points
- Target: 22,000
- Reward: 3,000 points
- Risk:Reward Ratio: 1:3
Note: The above is a trade sample. It merely demonstrates what salient points to pay attention to. No one trade sample can be correct for everyone. Also, there is no single objective, correct trade. Keep all that in mind when you consider our trade samples.
