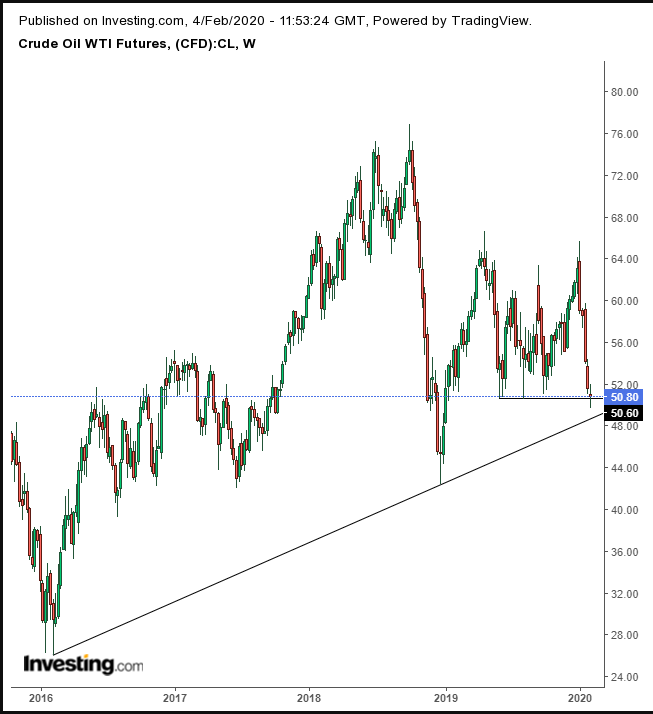
WTI is up about 1%, paring about half of yesterday’s selloff. After a year’s worth of gains for the commodity have been wiped out, is it time to get back in? Here's what to consider.
The price for black gold fell 21.12% between the $63.27 close on Jan. 6 and the Feb. 3, $49.66 low, satisfying the 20% requirement of an official market reversal. The status renders advances as upward corrections within a downtrend, suggesting today’s rebound is unsustainable.
While the 20% gauge is used to determine an official reversal—the new direction of which is seen to dictate the trend—the percentage number itself is arbitrary. The key issue is the trajectory in which the peaks and troughs move: up or down. It's the directions that demonstrate whether supply or demand is leading the trend.
However, we can find clues for the change in the balance, based on probability, for an alteration in the course of the market, even before the actual change, as measured by peaks and troughs.

Our initial target has been fully realized, but now our secondary target of $42 is in play. On Monday oil closed below $50, for the first time since Jan. 7, 2019, falling below a staunch support since early June 2019.
When the price was at $49.91, it suggested that bears control the market, closing both below the 8-month support as well as below the extremely psychological, round-number.
So what does today’s rebound, to back above the $50 level, indicate? Well, it could certainly turn into a rally. For now, however, the price is struggling with clearing the midway level to $51, the area of support since June 2019, suggesting the bears haven’t retreated.
Medium-Term and Long-Term Trends Meet
Note the importance of the $50 level in this market dynamic, as the support since June 2019 is meeting up with the long-term uptrend line since the February 2016 bottom of $26.05, the lowest since 2003. If this uptrend line breaks, it would be the strongest signal of the rally since the 2016 bottom following the rally, putting the $2 low of 2018 on the table.
Meanwhile, the price bounced back above $51 and the next move is anyone’s guess. On the one hand, if prices consolidate at this level, it could be a bottom, with upside potential back to the $60’s. On the other hand, if the $50 level doesn’t hold, we could go as far in the opposite direction.
Trading Strategies – Long Position Setup
Conservative traders should wait for either rising peaks and troughs to go long, or for a slip below the long-term uptrend line.
Moderate traders may join a potential uptrend after a close above $54 and a dip for an entry closer to the $50 support.
Aggressive traders may go long now, with a stop-loss below yesterday’s low.
Trade Sample
