Historically, the yen climbs during January as Japanese investors repatriate the currency and adjust portfolios, increasing yen demand. At the same time, other non-American investors do the same, pressuring the dollar on the supply side.
In seven of the last ten Januaries, the yen gained on the dollar. FX traders also remember last January’s flash crash, when the yen surged as much as 3.6%, on Jan. 3, 2019.
Will the yen see a boost this January, as well?
This year there's one major distinction. No apparent short build up has materialzed, as was the case in recent years.
In fact, with net short non-commercial futures positions of 42,000 in the week ending Dec. 17, that's fewer than half the 99,000 positions in place at the same time in 2018, and just a third of the 116,000 of 2017. It's also significantly less than the 87,000 of 2016.
So, how to proceed? An analysis of the charts can help clarify some of the dynamics at play.

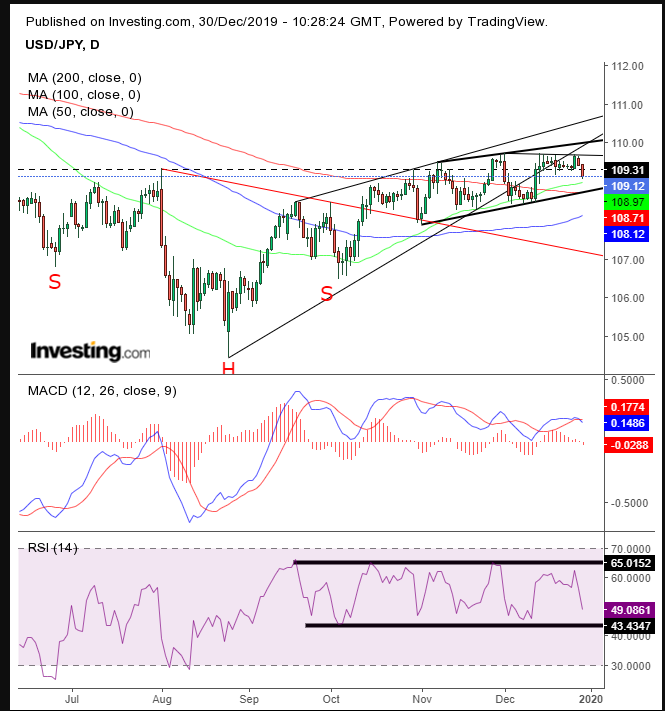
It’s a complicated chart, so let’s break it down.
The price bottomed in late August. The lows of the climb can be traced with an uptrend. The price ascended till it may have completed an asymmetrical, down-sloping H&S bottom.
Opinions vary on the reliability of such a pattern, in terms of its trade-mechanical structure. Will the dynamics that follow a H&S reversal uphold such a distorted pattern? We don’t know.
Back to the uptrend line since the late-August bottom. The price has now fallen below it for the second time. Generally speaking, that is the first sign of a potential reversal.
However, after a H&S bottom, in about 65% of cases, there is a return move, and — after a steep incline — the price could fall below the uptrend line (from the head to the right shoulder) but that doesn’t necessarily mean a reversal. However, it’s possible that the return-move already took place, when the roughly 1% penetration on Aug. 15 was followed by a pullback on Aug. 30 that successfully retested the neckline.
Concurrent to retesting the neckline, the price developed an ascending channel, which is bullish. However, note that it has been weakening since Sept. 18, starting with the first resistance line that traces the highs, before the H&S breakout. The price’s ascent flattened to a new resistance-line (channel top), from Nov. 7 to Dec. 2. And, finally, again, from Dec. 2 to Dec. 26.
While that doesn’t necessarily mean the rising channel will fizzle out, it’s a warning sign of a potential reversal.
The 50 DMA crossed above the 200 DMA, triggering the much-desired golden cross for the first time since July 2018, which predicted the 1.75% rise that led to the Oct. 3 peak.
The MACD and RSI indicators have been ranging since mid-September, underlining the lack of clarity for the price. Therefore, investors should wait for a breakout, while aggressive traders can range trade.
Trading Strategies
Conservative traders should stay out of this trade till a clear trend emerges.
Moderate traders may enter a long position after the price consolidates at the bottom of the channel and retests the support, for a better entry.
Aggressive traders may short if the price retests the channel top and go long when it reaches the bottom.
Trade Sample – Long Position
