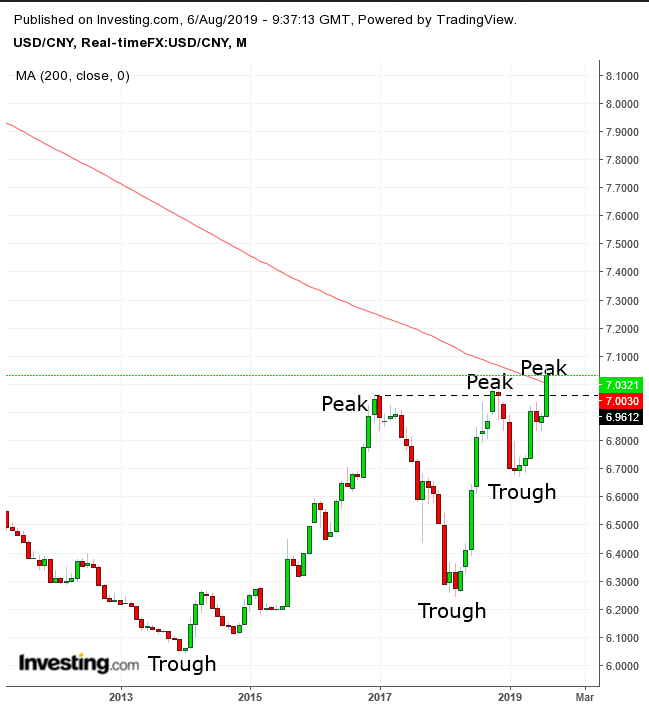
The Chinese yuan could very well be the critical indicator for whether the U.S. market is topping out or not.
Markets plunged after China allowed its currency to weaken below the 7 yuan to dollar level yesterday—which has been considered a red line—for the first time in over a decade. This was part of China’s retaliation for U.S. President Donald Trump’s slapping another tariff of 10% on all remaining $300 billion Chinese imports.
Trump has been accusing the Asian country of currency manipulation since he ran for president, and it's still one of the main points of contention in the trade dispute between the U.S. and China.
The fact that China allowed its currency to weaken past the 7 psychological level was its warning that they will play dirty if they have to, despite what their officials have been publicly saying.
The People's Bank of China today stepped up to defend the 7 level, with the result that the worst global selloff of the year eased, and U.S. futures are back in the green. This shows a positive correlation between the Chinese currency and global equities, including U.S. stocks, as the trade war dynamics have turned the yuan into a leading indicator for equity markets.

USD/CNY posted a new peak, extending the long-term uptrend since the 2013 bottom. At the same time, the pair crossed above the 200-month MA for the first time since it fell below it in 2007.

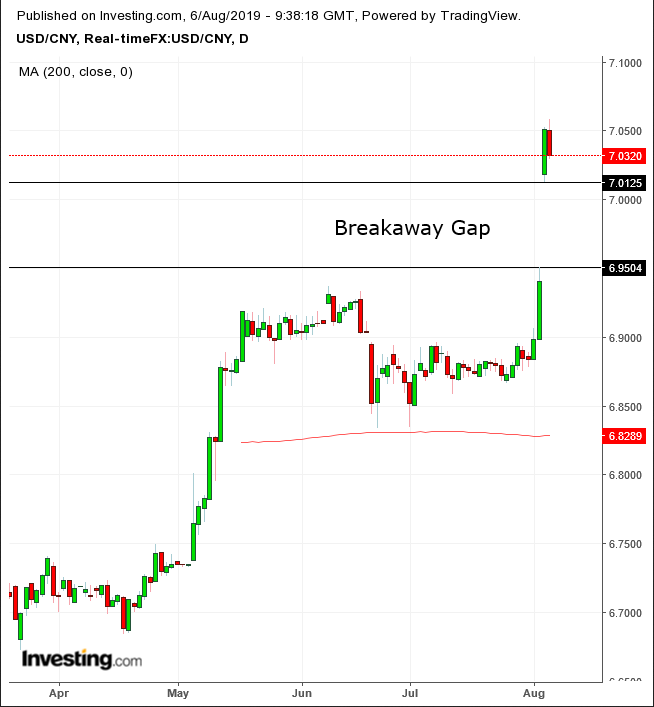
In daily price action, the USDCNY opened 1.28% higher today – creating a breakaway gap – and closed 1.58% higher. A breakaway gap occurs as all market players are on the same side, since no one is willing to take the opposite trade. The bottom of the gap becomes a support, as traders are still shaken up by the violent move. This gap broke away from a three-month consolidation that was repeatedly supported by the 200 DMA.
Trading Strategies
Conservative traders would stay out of this trade, as the risk is higher since the yuan is not entirely a freely traded currency and the PBoC can always intervene.
Moderate traders may enter a long position after the pair dips toward the 6.96 gap-bottom after it proves its support.
Aggressive traders might risk a contrarian short position upon a rally, hoping for the gap to be filled.
Trade Sample
Entry: 7.0400, upon a rally
Stop-Loss: 7.0500
Risk: 100 pips
Target: 7.0100
Reward: 300 pips
Risk-Reward Ratio: 1:3
