IBM's (NYSE:IBM) corporate results met expectations, yet its stock fell as the company reported the third straight quarterly declines and failed to provide guidance—the same lack of information that scared investors at the end of 2018, sending stocks to the brink of a bear market.
The release of earnings pushed stocks down 6.5% on Oct. 20. Is this a buying dip, or the beginning of a bigger selloff? We’re betting on the latter. Here’s why.

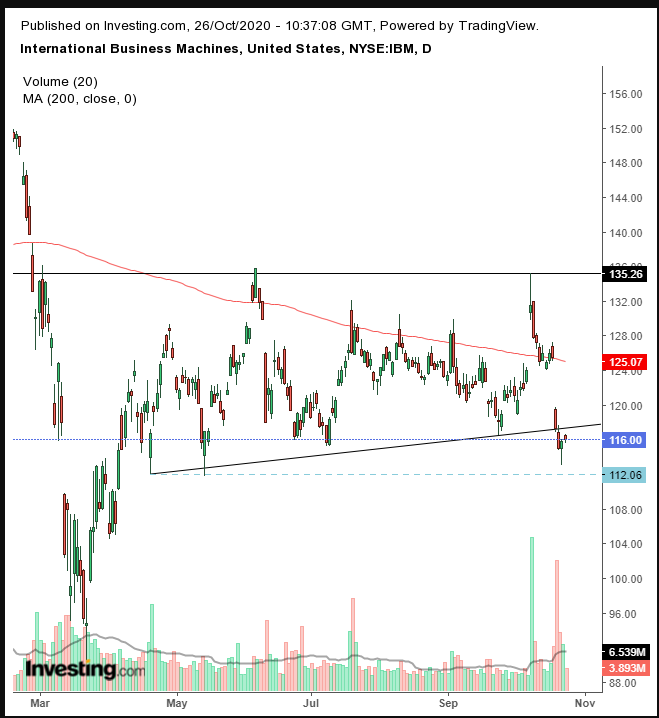
The post-earnings plunge weighed the price down to the support of the neckline of a top. It took buyers and sellers to fight it out for the next couple of days to achieve a bonafide downside breakout. What makes us confident about the breakout’s integrity is the volume—the highest on a down day since the same 2018 selloff mentioned above.
However, there was an earlier day with higher volume, on an advancing market. It was on Oct. 8, when the stock peaked out after finding resistance at the June 8 high.
Oct. 8 turned out to be a shooting star—when sellers overcame buyers, pushing the price all the way back down to near the open. The taller they are, the harder they fall, turning this outstanding green volume day—the highest since Oct 2017 into a bearish signal.
The 200 DMA pushing prices down toward the bottom’s breakout adds to the bearish picture.
Note, Thursday’s trading produced a hammer—the reverse of a shooting star, as buyers push back the sellers and therefore a bullish stance—as the price reached the lowest levels of the range since Apr. 21. Some traders who remember the 20% surge that followed may be hoping for another such round, adding demand.
This dynamic, the bullish hammer at the support since April, may cause a return-move, to retest the integrity of the top, when buyers push against the sellers. We’re betting on the sellers, on the presumption that the downside breakout will have encouraged short sellers and discouraged buyers.
Trading Strategies
Conservative traders would wait for evidence of distribution, with a decisive selling day manifested with at least one long, red candle falling away from the neckline.
Moderate traders would be happy if the price returned to the neckline, for a better entry, if not for confirmation.
Aggressive traders could sell now, after writing out a coherent trade plan they would commit themselves to.
Here’s an example:
Trade Sample
- Entry: $116
- SL: $120
- Risk: $4
- Target: $100
- Reward: $16
- RRR: 1:4
Author's Note: This is a sample only. If you’re too lazy to read the actual post or do not understand it do NOT trade. You’re not trading; you’re gambling. Your timing, account and temperament will affect the success of this trade and your overall trading. Customize the plan to your needs. If you don’t know how to do that, do NOT trade. Good trading!
