The recent escalation in the U.S.-Sino trade war is China’s latest reported threat to ban exports of rare earth minerals, in retaliation for the U.S.'s move to block Chinese companies such as technology titan Huawei from buying essential products such as computer chips from the U.S. Rare earth minerals are a crucial component in the production of many computer chips.
It's an ill wind that blows nobody any good, as the old proverb goes. However, for investors who want to play the current market narrative, there's one ETF that could have an upside.
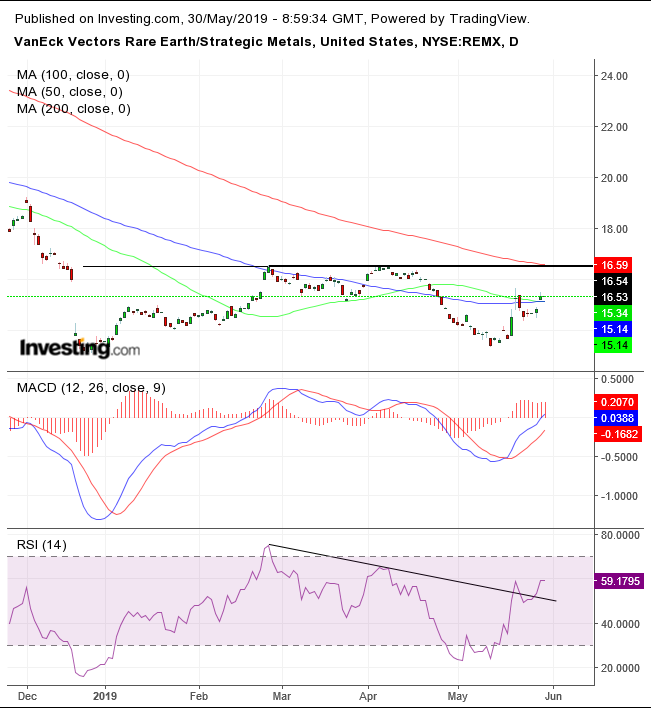
VanEck Vectors Rare Earth/Strategic Metals (NYSE:REMX) jumped 15% in two weeks, after scratching the December bottom, which itself was 6% above its 2016 rock-bottom, the lowest ever. What’s interesting is that while this made big news yesterday, the price has been escalating since the May 13 bottom.
This is a classic example of investors buying on rumors. The question is whether now that it's been splashed across global headlines, will they sell on news? The answer is, it depends.

The fund jumped above both the 50 and 100 DMAs, as the 50 DMA—at least for now—found support above the 100 DMA. It closed at the highest point since April 24, when it closed at exactly the same price: $15.34. However, where this gets interesting is if it crosses the $16.54 line, the highs of February and April, making up the neckline of a double bottom.
Underlying ithe significance of the price level is the 200 DMA, in red, at $16.59, just 5 cents above the neckline.
The RSI provided an upside breakout to its downtrend line, suggesting price would follow momentum and execute its own penetration. The MACD provided a buy signal, with the short MA climbing above the zero line, ahead of the long MA.
Trading Strategies
Conservative traders should wait for a close above the neckline with at least a 3% penetration – with the pricing staying above the neckline for at least three days, preferably to include a week-end - to weed out pesky bull traps. Then, they would wait for a potential return move, to retest the neckline’s support, manifested by at least a single long, green candle engulfing a red or small candle of either color.
Trade Sample
- Entry: $17.00, after satisfying a 3% upside breakout on the first advance and proving a support base on a second advance.
- Stop-Loss: $16.00, round number below the neckline, to allow for whipsaws.
- Risk: $1.00
- Target: $20.00, round psychological number and conservative implied target of double-bottom pattern.
- Reward: $3
- Risk-Reward Ratio: 1:3
Moderate traders would be content with 2% and a two-day penetration, to limit the odds of being caught on the wrong side of a whipsaw. Then, they might wait for a likely return move to limit exposure, but not necessarily to retest the pattern.
Trade Sample
- Entry: $16.75, after reaching at least $16.85, to satisfy a 2% penetration.
- Stop-Loss: $16.25, below the neckline.
- Risk: $0.50
- Target: $19.25, below the November high and $20 round psychological number.
- Reward: $2.50
- Risk-Reward Ratio: 1:5
Aggressive traders may risk a long position with a close lasting at least one day with a penetration of at least 1%, to provide some assurance against being stopped out.
Trade Sample
- Entry: $16.70
- Stop-Loss: $16.50
- Risk: $0.20
- Target: $18.70, below December's high.
- Reward: $2.00
- Risk-Reward Ratio: 1:10
