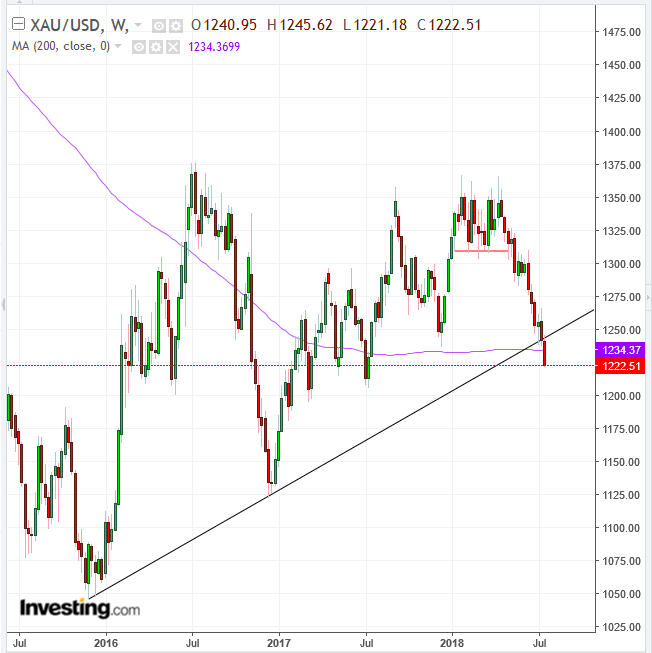
Gold has just triggered a dual sell signal, after the dollar edged higher for a second day, today, boosted perhaps by Fed Chair Jerome Powell's Congressional testimony yesterday. The global reserve currency is only 0.07 percent away from its June 28 close—its highest level in a year.
The precious metal is typically negatively correlated with the USD for two fundamental reasons:
-
The dollar provides a yield, in the form of interest, while gold does not. When interest rates dominate market dynamics, the USD is expected to rise versus gold. Conversely, when rates are not squarely in focus, gold is likely to gain versus the dollar.
-
Investors typically consider the dollar a risky asset, while gold has been the classic safe haven.
However, since March 12 when the US-China trade war crisis began, the traditional market dynamic described in point two, above, seems to have evaporated, leaving traders befuddled.
While the price of gold did, at first, rise, it topped out in mid-May, slipping 7.5 percent during the period. Interestingly, its safe haven peer, the yen also dropped 6.3 percent over the same period.
Ironically, while the US president may have ignited the trade dispute, the USD has taken on the position of ultimate safe haven during global turmoil—usurping the role once played by gold and the yen. The same thing occurred after the 2008 financial crash, which was sparked by the US subprime market, but resulted in the dollar gaining ground as a safety trade.
In a sign of just how negative traders now are on gold, the precious metal just triggered three bearish signals this week.

Price crossed below both its uptrend line since November 2015 and the 200-week moving-average and posted a lower trough. It also posted a trough that was lower than the December, 1,236.59 low. All that's left is a peak lower than the 1,366.13 high, posted in late January.
But how can one tell when a peak has effectively taken place? Evidence of the following two events is required:
-
A rise, and
-
A decline that follows—or the price may have just been in the middle of a move—before forming a peak higher.
Moreover, a new move, either up or down, must cover at least a third of the previous move. In this case, the next rise needs to include at least one third of the preceding slide from the January, $1,366 peak, to be considered a valid upward correction, as opposed to meaningless noise that doesn't reflect the overall trading psychology.
But that's just half of what constitutes a peak. It must also be followed by a decline, in order to "peak" out.
Again, only a downward move of at least one third of the preceding climb will confirm a valid decline that projects internal market dynamics. This hasn't yet happened on the weekly chart, which would reflect the long term, although it did happen on the daily chart, when the price topped out, revealing the midterm trend reversal.
Thus, while we don't yet have an official long-term reversal, we do have the trifecta of bearish signals.
Trading Strategies
Conservative traders would likely wait for a second lower peak, to complete the official trend reversal.
Moderate traders may be satisfied with evidence that the broken uptrend line and 200 WMA turned from support to resistance, signaling a flip in market psychology, with at least one long, red candle following a rise to the uptrend line or 200 WMA.
Aggressive traders may risk a short now, providing they can formulate an equity management plan that ensures a minimum 1:3 risk-reward ratio, based on the supports and resistances—price levels where demand and supply are expected.
