Why have China and Russia — America's two biggest opponents in trade and global dominance — been amassing gold? Might they be planning to dump U.S. Treasurys?
China’s gold reserves now stand at more than 1,950 tons. Russia has more than 2,200 tons, the fifth largest stockpile by country — and is set to take fourth place, surpassing France. China is currently in sixth place.
Both countries are engaged in lingering disputes with the U.S.: China over trade, and Russia as the subject of sanctions. They both also oppose the U.S. in global affairs and have long been irked by American dominance in terms of the U.S. dollar, necessary for reserves as well as global transactions. Indeed, China began to take steps to inch into the U.S. currency’s global dominance when it launched yuan-denominated oil futures contracts.
Meanwhile, Russia’s Treasury holdings have fallen to a 12-year low, and China’s to a two-year low. Also, the dollar has fallen to 61. 9% of global reserves, its lowest since 2013, according to the IMF. Global central banks have been reducing dollar holdings since the global trade war to limit their dependency on U.S. policy.
Despite many claiming China couldn’t possibly dump its Treasury holdings as part of the trade war, the odds for that scenario materializing are increasing steadily.

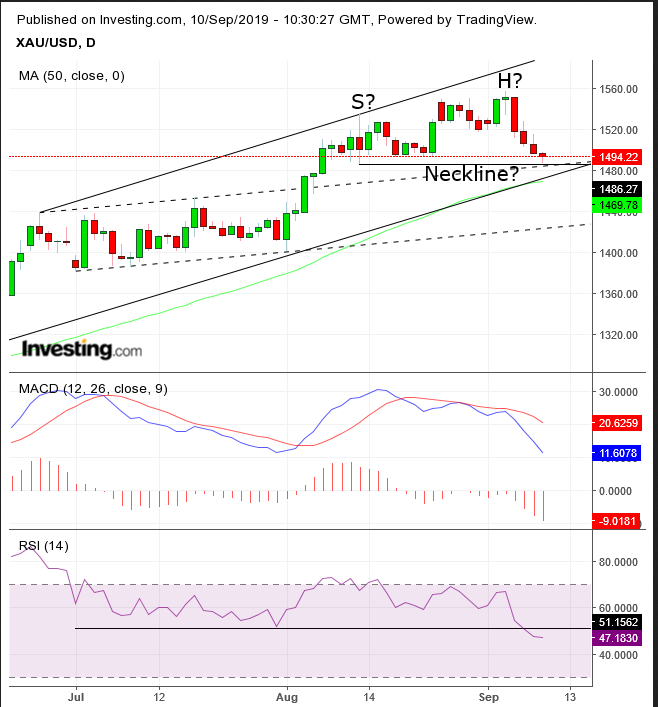
Gold has fallen for its fourth straight day amid market risk. However, from a technical point of view, it was a correction within an uptrend.
The price bounced after nearing the bottom of its uptrend line since late May, which turned into a rising channel in late June. The chart shows the supply-demand trend symmetry, in which the previous rising resistance (dotted line) of the June 25-Aug. 2 congestion met up with today’s support. Another technical coincidence is the 50 DMA, which melded with the channel bottom. Note, also, the horizontal underpin of the Aug. 13, $1,486 level that meets up with the surrounding support.
Today’s bounce is creating a hammer, which would complete upon a close. This candlestick is considered bullish on the premise that the intraday drop would attract short sellers, while the rebound would then cause a short squeeze, turning that supply into demand. When that initial short-squeeze bounce occurs, bulls would be expected to rejoin, as the confirmed support of the channel bottom signals another leg up.
Warnings: Both the MACD and RSI provided sell signals. The MACD’s shorter MA found repeated resistance below the longer MA, in negative divergence to price allies in the same period. The RSI fell to the lowest since late May, in negative divergence to the price. These indicators may signal a potential H&S top since early August, as the current support might be built around the dynamics of forming the head, following the left shoulder.
While we keep a cautious eye on these indicators, we prefer to rely on the price action, as described above. The $1,486 low of Aug. 13 will be our downside red-line and the same day's $1,534.94 high (potentially, the left shoulder) would be our max upside target, in case it does turn into a reversal pattern.
Trading Strategies – Long Position Setup
Conservative traders would wait not just for the hammer's close, but also for confirmation with a long green candle.
Moderate traders may enter a position upon the hammer’s close, preferably waiting for a buying dip as the price tests the support.
Aggressive traders may enter at will, after establishing a trade plan that fits their needs.
Trade Sample
