The spectacular stock market rally since the end of last year has set in motion a powerful risk-on cycle. Increased confidence in the economy, growing optimism that equities will just keep going higher — it’s easy for traders to get caught up in this whirlwind and lose track of what is the cause and what is the effect.
This heightened appetite for risk triggered a slump in gold. What’s especially noteworthy is that gold has been falling in tandem with the dollar. That's unusual: in the normal order of things the commodity trades in opposition to the currency.
However, the yellow metal has been on a downward slide for the last six days, while the dollar declined for the last two. Indeed, the greenback has been slipping since it’s April 2 high. Gold has been lower since then, as well. In other words, even dollar weakness, indirectly making gold cheaper, hasn’t helped boost the price of the commodity.
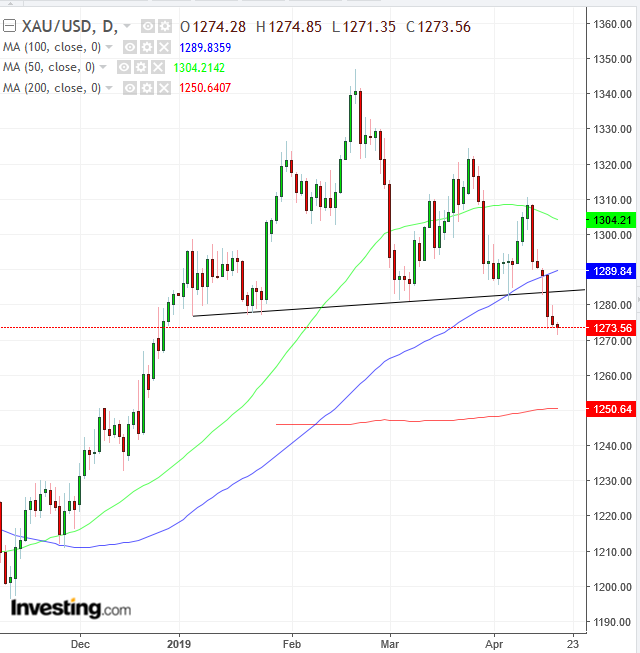
This unusual correlation suggests to us that the precious metal's weakness will continue, and the technical patterns seen in the chart below back up that conclusion.

Chart powered by TradingView
Gold completed a Head & Shoulders top, after falling below the neckline, the line that connects the lows of a range since the start of the year, when equities took off. Both the RSI and the MACD provided observant technicians with a heads up, when they diverged from the rising prices seen in January-February.
Finally, the 50 and 100 DMA gave traders a warning of the downside breakout, when they failed to prop up prices.
Trading Strategies – Short Position Setup
Conservative traders would wait for the price to fall below the 200 DMA, at the psychological round $1,250 level. Then, wait for a pullback, which would demonstrate the MA provides resistance, with at least one long red candle, engulfing a green or small candle of either color.
Moderate traders could wait for the price to bounce off the 200 DMA and return to the neckline, for a better entry and not necessarily for proof of pattern.
Aggressive traders may enter a short now, or wait for an upward correction, to minimize exposure.
Trade Sample
- Entry: $1,280
- Stop-Loss: $1,285, above neckline
- Risk: $5
- Target: $1,260
- Reward: $20
- Risk-Reward Ratio: 1:4
