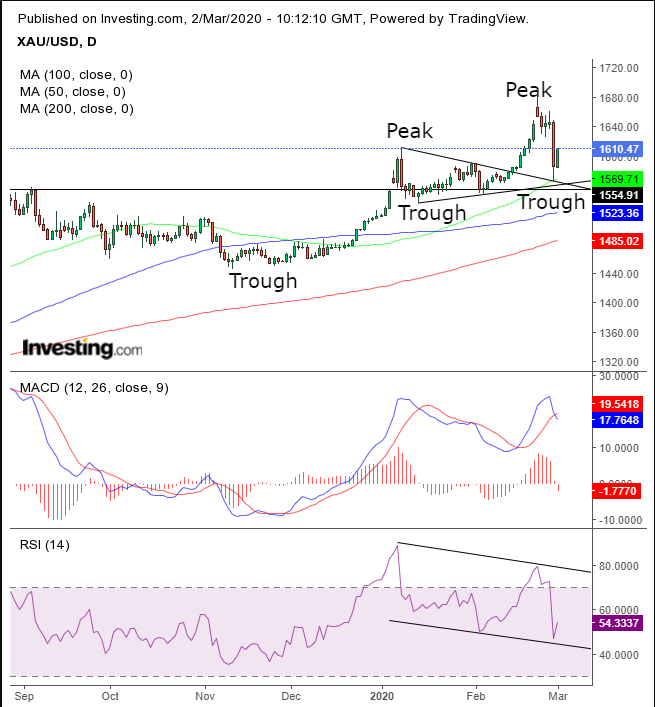
As gold sold off together with the U.S. dollar and equities over the past week, it's sent out very confusing signals. Investors and analysts struggled to make sense of it.
For example, ECL SALES left a comment beneath yesterday’s post that said: “gold had declined in 2008 too with the stock market. All asset classes had declined in tandem.”
While this is narrowly true, the big difference is that the dollar was surging, making gold more expensive. Now, the dollar was selling off with the yellow metal. So, what was holding gold down?
Another comment, from Anthony Dadlani stated: “there was panic selling with gold getting hit in a risk off market. It was a source of capital to meet margin calls.” And it's true that some have indeed made that claim.
But that would mean that the same investors who believed enough to invest in stocks also feared risk and demanded gold. To be sure, there is hedging, but would hedging take gold to its highest since 2012? Even if it did, today’s rebounds in futures may suggest that margin calls have been met.
Gold is now in an ideal position for a rebound, but then again, so are shares. Could both rally together? They did after Trump’s victory. One thing that would be sure to make the precious metal's ascent lighter would be the dollar extending its rout after the Fed signaled a rate cut, falling through an uptrend line since the beginning of the year.

Gold dropped from its 7-year high to the very top of a previous continuation pattern, whose apex coincided with the August-September highs. The 50 DMA also showed up for added support.
On Friday, the precious metal touched the top of the pattern and jumped a whole percent. Today, gold added to the climb, wiping out about half of Friday’s losses, forming another dip in the rising series of peaks and troughs.
So far, all this paints a very bullish picture. The only caveats are the leading RSI and lagging MACD indicators, which are providing bearish signals. We, however, think the disorderly market dynamics account for these conflicting signals and feel more confident paying attention to the meat of technical analysis, price action.
Trading Strategies
Conservative traders would wait for the market to make sense — for gold to rise when equities fall — and for the technical indicators to line up, with the MACD and the RSI turning bullish, before risking a position.
Moderate traders may risk a long position if the price returns toward the $1,570 support of yesterday’s low, or at least toward the $1,590s level of the late-January highs.
Aggressive traders can enter a long position at will, providing they understand the risk of a whipsaw back toward the pattern.
Trade Sample
- Entry: $1,600
- Stop-Loss: $1,570
- Risk: $30
- Target: $1,690
- Reward: $90
- Risk:Reward Ratio: 1:3
