Trade tensions are putting investors on the defensive, and the yen is geared up for another leg in last week’s rally.
Markets appear paralyzed as investors seek a reliable view on whether there is any hope for a trade deal between the U.S. and China. For now, traders are idling engines, waiting for a sign. Investors who throw caution to the wind may be racing into a dead-end.
The news is focused on the crippled U.S.-China trade deal that's beset by ongoing conflicting reports. First we hear that the American government will extend a license to allow U.S. firms to do business with Chinese telecom giant Huawei, then we hear that China doesn't expect a broad deal any time soon.
There was one piece of Asian trade news, however, that received less attention. Japan’s lower house of parliament approved today a partial trade deal with the U.S. This limited pact paves the way for tariff reductions next year.
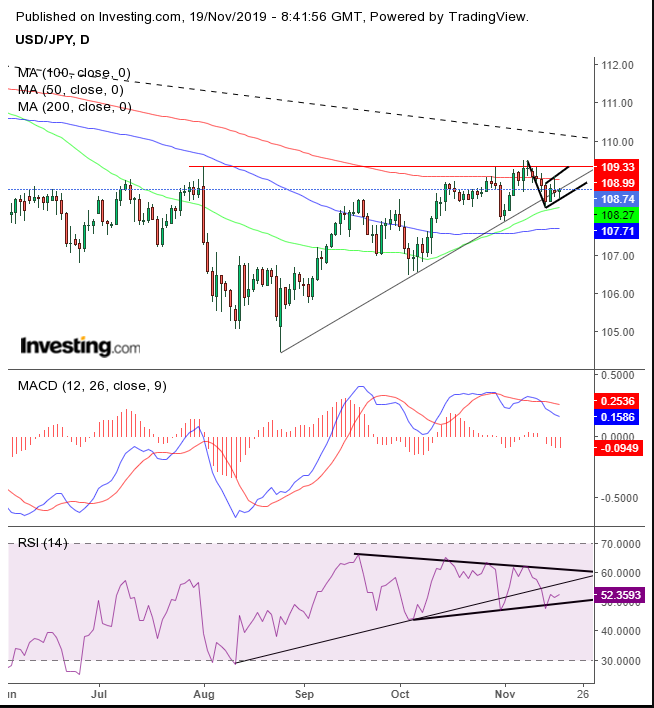
So, while the Chinese yuan has declined in the last week, the Japanese yen has strengthened. Another yen driver is, naturally, its safe haven status, something the Chinese currency does not enjoy. And the USD/JPY pair is setting up for a downside breakout, as the yen extends its rally.

The USD/JPY pair has been unable to cross the 109.33 peak of Aug. 1 (red line). Still, bulls kept trying to storm the bears’ defensive line, tracked by the uptrend line since the Aug. 26 bottom. However, as time went on the pair experienced more pressure, as the downtrend line since the Oct. 2018 high neared. The 200 DMA traced the downtrend line, then fell to lend resistance to the selling pressure since Aug. 1.
The price has been consolidating with an upward tilt since its Thursday low, after a four-day selloff — converging with multiple technical milestones: the uptrend line since Aug. 26, the 109.33 resistance since Aug. 1 and the long-term downtrend line since the October 2018 high — all squeezing the price between the 200 and 50 DMAs.
The upward tilt of the range is the natural setup for a bearish, falling flag. The multi-tiered technical forces here further serve to demonstrate the explosive potential of a breakout. The rising flag’s bearish bias — as bulls attempt to absorb the short selling of the bears — is reinforced by the fact that the price is flirting with the short-term uptrend line, ahead of its convergence with the long-tern downtrend line, and the added pressure of the 200 DMA.
The MACD provided a sell signal. The RSI already fell below its uptrend line of the same duration and has been forming a symmetrical triangle. A downside breakout would be a momentum breakdown, and would be likely to pull the price lower.
Trading Strategies
Conservative traders would wait for a fall below 106.50, the Oct. 3 low, before committing to a short.
Moderate traders would be content with crossing below the 100 DMA.
Aggressive traders may risk a short with a close below the 50 DMA.
Trade Sample
