Facebook (NASDAQ:FB) is due to release earnings after market close on Wednesday, Jan. 29, for the fiscal quarter ending December 2019. The forecast is for EPS of $2.52 on revenue of $20.88 billion, up from the corresponding quarter last year, when the company posted $2.38 EPS on $16.91 revenue.
Analysts expect strong earnings for the social network leader, despite regulatory scrutiny, as not only has user activity not diminished — even after a series of serious privacy abuse scandals — but it is actually on an upswing. And where the users are, the advertisers go, regardless of any other consideration.
Having said that, Facebook may very well find itself in the crossfire of a panic-induced, broad market selloff on fears that the deadly Chinese coronavirus may spread, hitting global growth, which, in turn, would hit the social media giant’s profits.
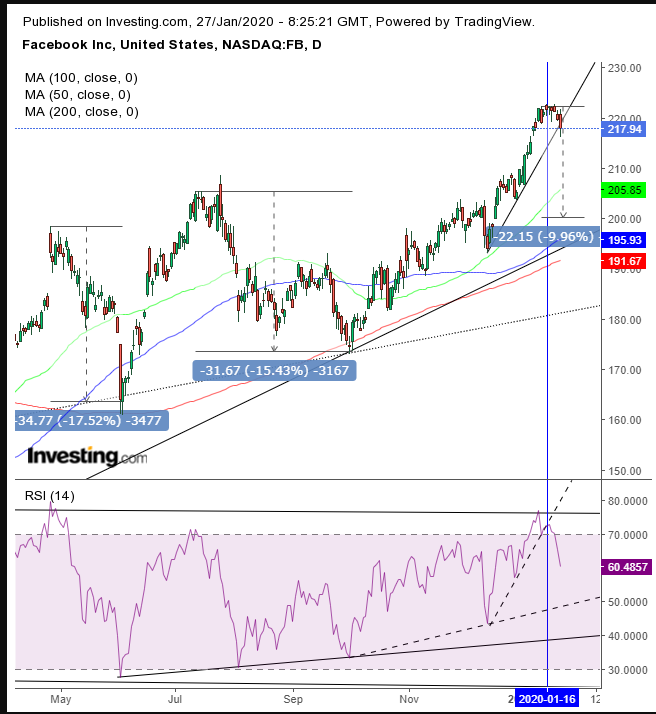
Interestingly, not only does the technical chart provide short-term warning signals, as we might expect due to the current risk-off, but there's also a long-term bearish signal, as well.

On Friday Facebook dipped below its uptrend line since the Dec. 13 low, after the RSI had done the same a full week earlier (blue, vertical line).
The RSI scratched the overbought level of 77, its highest since April 25. That level preceded a 17% drop to the low of $161, the June bottom, where it found support by the 200 DMA.
Then, on June 11, when the RSI reached a much lower overbought level of 71, a less demanding correction, the price dropped about 15% until Oct. 3. Now the price is about 9% above the uptrend line, the support-significance of which is underscored by the tracing 200 DMA. This rush to support at the $200 psychological, round number makes it a viable target.
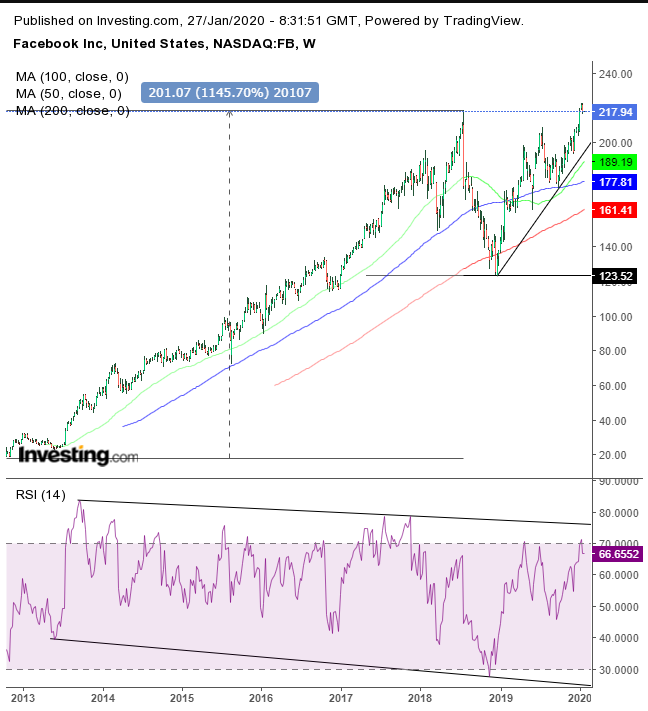
However, the charts are also showing a long-term bearish signal.

The weekly RSI has been providing a negative divergence. While the stock has been surging, up 1,145% since its post-IPO, September 2012 bottom, the RSI indicates that momentum has been steadily declining.
If the RSI falls to its previous low of 48, which it posted at the end of September 2019, it might suggest the price will also revisit the price of that same date: $171. If, however, the 48 RSI level fails to hold, we might see the price slumping to its low, on Dec. 10, of $123.52, forming a massive double-top, starting July 2018.
Trading Strategies
Conservative traders would not trade against the uptrend and would wait for signs of support at the $200 level for a long position.
Moderate traders may short if at least a full candle falls below the uptrend line since the Dec. 13 low, followed by a failed retest of the broken uptrend line.
Aggressive traders might short now, providing they understand the risk of trading contrary to the trend and have a trade strategy in place that they are committed to and that affords them an attractive risk-reward ratio.
Trade Sample
