Stock market history was made yesterday. The Dow Jones Industrial Average’s oldest surviving component, Exxon Mobil (NYSE:XOM), was kicked off the mega cap index, put out to pasture as the old-world industrial economy withers and a new, technology-driven era blossoms.
Earlier this week, we discussed the ways in which the tech sector is taking over the market. It's outperforming on any and every timeframe over the past five years. We posited that the worst global pandemic in 100 years has only accelerated the world's reliance on technology—and that the future is here and now.
Exxon, in some form, has been a Dow component since 1928, but the weakness of the stock, along with the broader energy sector, represents the flip side of the technology takeover. Energy now makes up a paltry 2.5% of the S&P 500 Index, down from 6.84% five years ago and from 10.89% a decade ago. During the same time, tech surged from 18.48% of the benchmark in 2010 to 28.17% today.
Shares of Exxon plunged yesterday, down 3% after news of the removal. A study of the forces of supply and demand suggest the price will shortly be falling far more steeply.

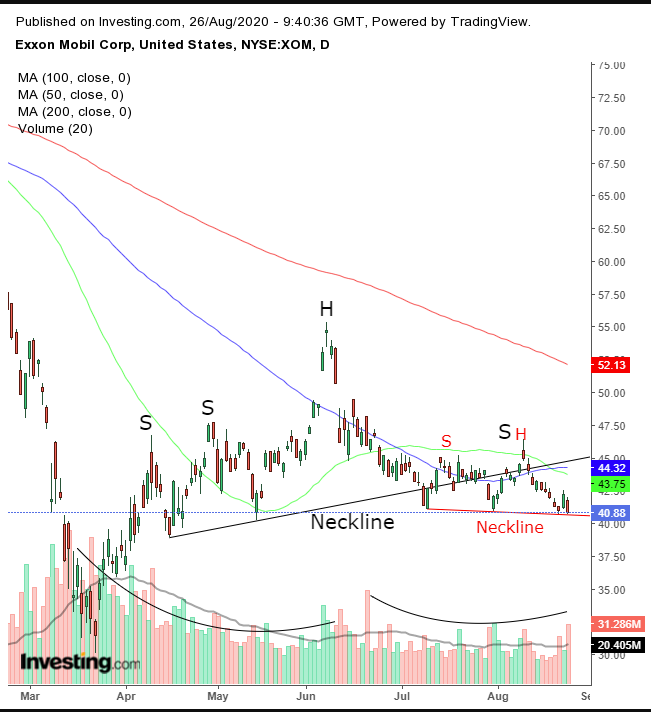
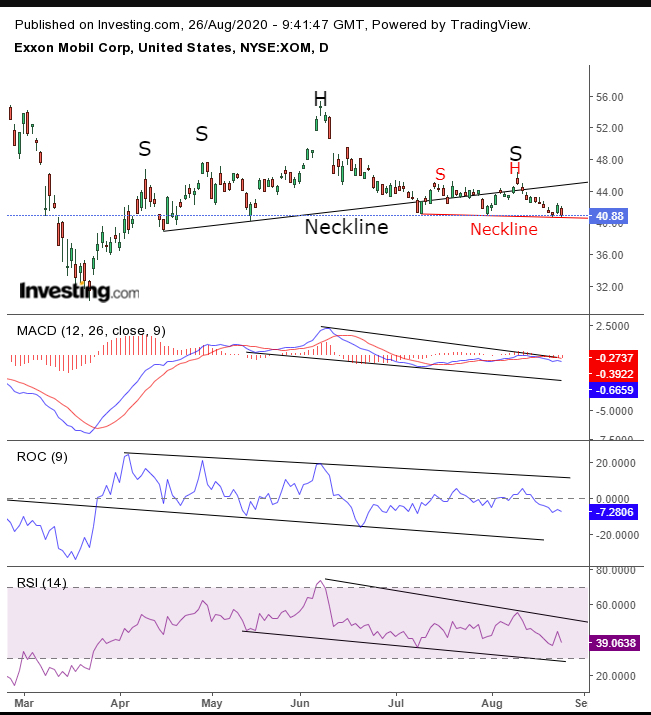
The stock has been trading within a H&S top, one in which demand has been too sparse to properly form the right shoulder, as prices fell through the July 9 neckline, and attempted to claw back above it throughout July and August, but to no avail. That trading pattern itself potentially created a secondary, smaller H&S top. Yesterday’s selloff is testing that secondary neckline.
The 200 DMA represents the long-term downtrend and has suppressed the June 8 high, forming the head. The 50 and 100 DMA had a tug of war within the formation of the right shoulder. It was touch-and-go whether there remained sufficient demand to push prices higher than the neckline.
Note how the volume dried out with the rise toward the head, then spiked briefly, like a candle glowing more strongly before it sputters out. The same volume pattern, albeit not as sharp, repeated with the attempt to drive prices back up, but alas, participation was to the downside, which tells the whole story.

Note how the MACD, ROC and RSI are all projecting a lower outlook based on price average and momentum comparisons. It’s rare to see everything line up and point in the same direction.
On the other hand, that uniformity may catch the eye of contrarian traders, who might interpret this apparent consensus as an indication selling and shorting could be peaking, signaling the risk of an opposite trade. That, however, requires impeccable discipline and money management skills.
Trading Strategies
Conservative traders would wait for the smaller potential H&S to complete, as its neckline may provide support for a bounce.
Moderate traders might also short the potential rebound, counting on resistance from the July and August highs, as well as the broken trendline that makes up the neckline.
Aggressive traders may enter a contrarian long position, catching the potential right-shoulder-making-rally, before shorting with the rest of the market. However, aggressive trading only means you must be more, not less, careful than cautious traders. It requires more discipline and additional trade prep. If you didn’t understand this post and the trade-implied risks and how to manage them, do NOT trade.
Trade Sample – Short-Term, Aggressive, Contrarian Long Position
- Entry: $40.75 – upon a dip
- Stop-Loss: $40.50 – below Friday’s low
- Risk: $0.25
- Target: $44.50 – below the psychological round number, July-August highs and broken uptrend line
- Reward: $3.75
- Risk: Reward Ratio: 1:15
Author's Note: This is just a sample to showcase the essential parameters of a coherent trade plan. You may change the inputs, such as entry, stop-loss and target to suit your budget, timing and risk aversion. Remember, winning or losing this trade won’t turn you into a successful trader, or indicate that you're not. That requires long-term statistical consistency, which involves many trades, making budgeting crucial.
