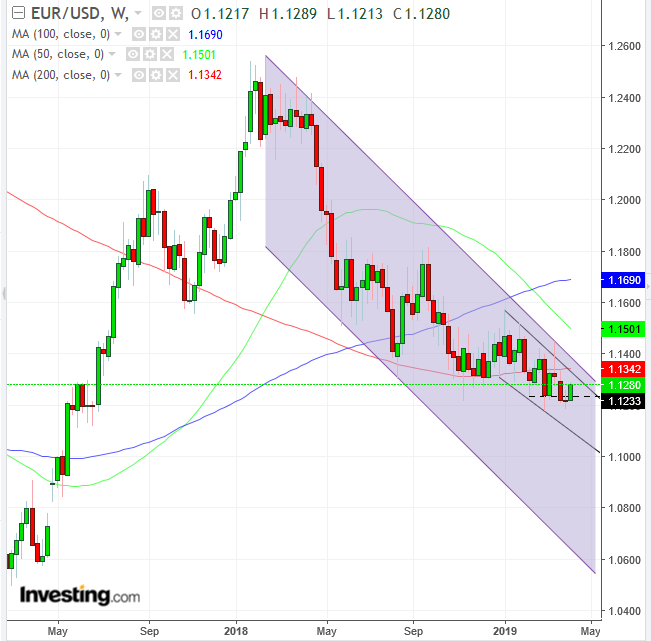
The euro is strengthening at the expense of the dollar for a second straight day, bringing the single currency's gain to 0.9% since it bottomed on April 2. We find this euro strength surprising, especially after the ECB’s warning of regional downside risks, forcing Mario Draghi to backtrack his plans to tighten monetary policy in recent weeks.
Yesterday's Fed minutes on the other hand revealed that policy makers “judge it appropriate to raise the target range for the federal funds rate modestly this year.” Perhaps the tepid inflation in the U.S. is what’s driving the euro higher. That, too, is unconvincing, as after all is said and done, the U.S. core consumer price index rose 0.1% MoM and 2% YoY, with inflation just missing the Fed’s 2.00 target, at 1.9%.
The euro area, however, is far below the target, at 1.4%. Why, then are traders driving up the euro? Fundamentally, we don’t know, but technically, it’s in a correction.

The euro has been trading within a descending channel since the beginning of the year, within a larger descending channel since late-January 2018, within a yet larger descending channel since its 2008 top.
The current rise began after reaching a support low going back to February (dotted, horizontal line), after reaching the bottom of the smallest of the descending channels. On the daily chart, the 200 DMA tracks the channel’s top, and on the weekly chart, as we can see, the 200 WMA is even lower, at 1.1342, while the 50 WMA traces the channel top, after falling below the 100 WMA as the smallest descending channel developed in February.
The 200 WMA really comes into its own here, as its technical significance is obvious: providing staunch support from mid-August till its breakdown in February, from which point it turned into a reliable resistance, in which the single currency managed to climb back above it only during a single week in late February.
The falling patterns over multiple time frames suggests an influx of interest, over converging trading and investing strategies, pointing down. Therefore, we are euro-dollar bearish.
Trading Strategies
Conservative traders would wait for the price to fall below the smallest descending channel, and maybe even to the bottom of the medium-term descending channel since January 2018, before relying on the downtrend’s integrity.
Moderate traders may wait for the price to reach the top of the smallest descending channel, over the top of the medium-term one, which may include a retest of the 200 WMA, followed by proof of resistance, with at least a single red candle engulfing a long green or small candle of either color.
Aggressive traders may short at will, according to their trade management, waiting for a fuller upward correction for a better entry or may enter now if they are able to withstand a fuller correction.
Trade Sample
- Entry: 1.1320
- Stop-Loss: 1.1350, above the 200 WMA
- Risk: 30 pips
- Target: 1.1230
- Reward: 90 pips
- Risk-Reward Ratio: 1:3
