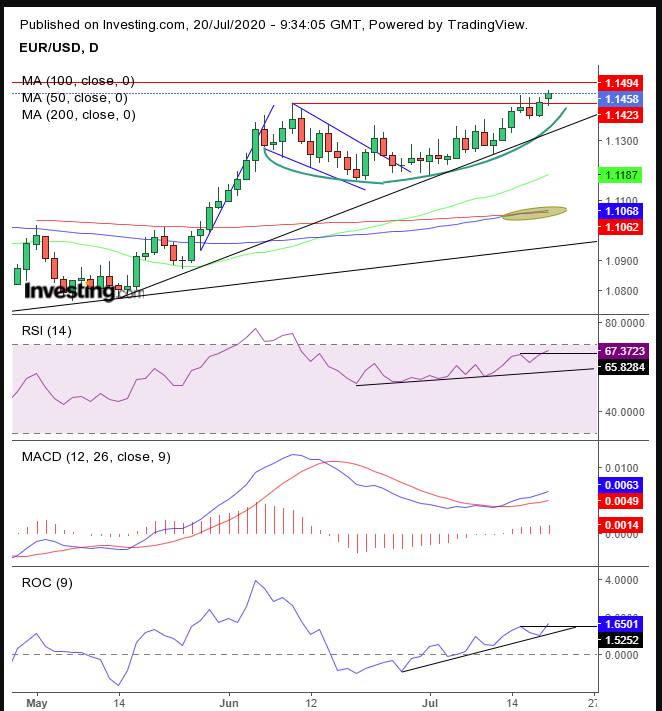
The euro has climbed to a four-month high, as traders have banked on a resolution to the stalemate on the EU's proposed recovery fund. It’s interesting to note that European stocks, and indeed Asian stocks and US futures, all fell this morning because of the gridlock.
While a stronger euro will weigh on European stocks, that doesn’t explain why Asian shares and US contracts have weakened for the same reason. As we have sometimes pointed out, it appears we’re witnessing an argument between currency and equity traders.
Meanwhile, German 10-year yields jumped by 1.5 basis points, confirming the risk-off sentiment behind the selloff in equities.
Meanwhile, currency traders pushed the single currency to break out of a six-week range, a bullish move, but it ain’t over till the fat lady sings, or the EU reaches an agreement.

The euro has completed a falling flag, whose downward tilt masked bullish activity. Fresh bulls have picked up positions that were previously unwound when profit-taking ensued following the 5% surge from the low of May 25 to the high of June 10. This rally was the euro’s longest winning streak since December 2013.
The breakout from the flag, however, was lethargic, and did not mirror the preceding move that made up the flagpole. Finally, today, traders seemed to have managed to break past resistance at the flag-top. Still, it’s important to keep up your guard. As we can see, in the past three trading days, the euro has attempted to clear the congestion.
Today is the first day that traders opened above the June 10 high at 1.1423. Still, we would feel more comfortable with a close at, or around, this level. But there’s more. The Mar. 9 high of 1.1494 underscored the psychological association to the round 1.15 level. The price plummeted 7.5% from that point in just 9 trading days to Mar. 20. Traders will need considerable confidence to try and take on those levels again.
For now, these are the indicators supporting the price: the 50 DMA has crossed above both the 100 DMA and the 200 DMA—thereby triggering a golden cross when rising above this longer-term average. This has put all three major MAs in a bullish formation. The MACD, RSI and ROC are also all on the rise.
Trading Strategies
Conservative traders would wait for an accumulation above the 1.15 level to show there is still demand, and supply has dried out at these levels. The minimum evidence for this would be a full green candle developing above the 1.1500 level.
Moderate traders may risk a long position upon a close above 1.15.
Aggressive traders may enter a small, contrarian short position, taking advantage of an incongruous market narrative, with the possibility that currency traders are too one-sided on this trade.
Trade Sample – Aggressive, Contrarian Short
- Enter: 1.1465
- Stop-Loss: 1.1475 – above the highs of the last three hourly candles
- Risk: 10 pips
- Target: 1.1405 – above psychological round number
- Reward: 60 pips
- Risk-Reward Ratio: 1:6
Note: This is just a sample. First, read the post. Feel free to change the parameters to suit your timing, budget, and temperament. Not every trade wins. If you expect it to, do not trade.
