After Bitcoin hit its first record close in three years, of $19,723 on Nov. 30, investors have once again become enamored of the digital currency. But value-driven investors, like institutions, might consider looking elsewhere in the crypto-universe for better bang for their digital currency buck.
While the world's most popular cryptocurrency may have provided investors with gains of 175% this year, perennial runner-up Ethereum gave stakeholders of that digital token more than twice those returns—almost 377% in additional value over the same period.
While Bitcoin is now only 8% below its apex, Ethereum is still -148% from its Jan. 13, 2018 record close at $1,380. That means that right now, Ethereum has 18.5 times the runway for growth before investors might question whether it's become as overvalued as Bitcoin.

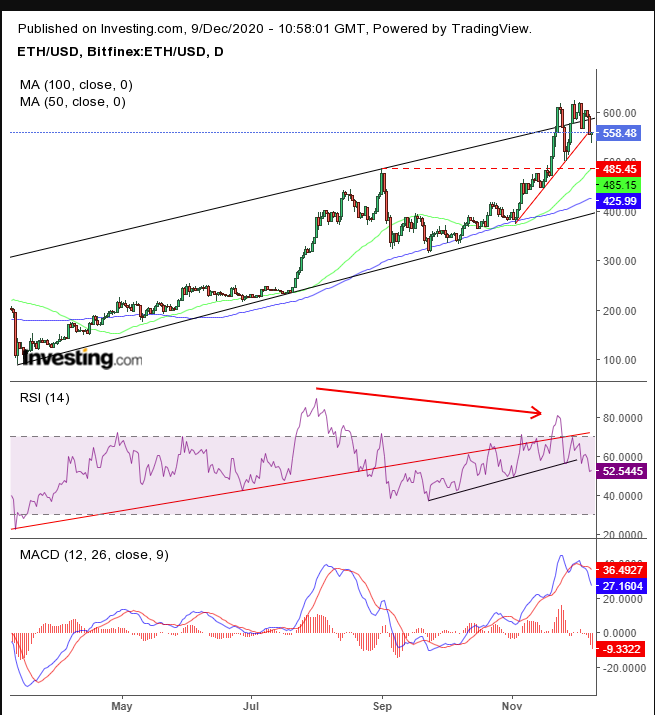
Ethereum has been trending higher within a rising channel since the March bottom. The 100 DMA confirms the channel’s support, while the 50 DMA traces the steeper incline.
More recently, ETH attempted to increase its rate of ascent by breaking through the channel’s topside but ultimately fell back into it. This occurred three times: Nov. 23, Nov. 30 and Dec. 5. Generally, after a failed attempt the asset shoots in the opposite direction, even moreso after three consecutive attempts.
That increases the odds of a return toward the bottom of the falling channel, giving bulls a chance to rest via profit-taking.
Concurrently, the MACD has provided a sell signal, with its short MA crossing below its long MA—as recent prices weakened compared to previous ones. The RSI topped out right under 81, signaling an extremely overbought condition, the most since early August which led to the price returning to the channel-bottom, shedding nearly 30% of value in the process.
The RSI is also providing a negative divergence. It failed to post a higher peak, as opposed to the price; rather, it found resistance by its broken uptrend line. The indicator also fell below the shorter uptrend line since Sept. 23.
While we expect the overall uptrend to remain intact, we anticipate a short-term take-profit correction.
Trading Strategies
Conservative traders should wait for the price to revisit the channel bottom and demonstrate revived interest, causing a rebound above $400. Alternatively, they’d join a steeper advance above the rising channel.
Moderate traders are likely to wait for that pullback, but may not have as much patience to wait for evidence of support at the very bottom. They might go in with any signs of demand along the way, or go in at the bottom, with a stop-loss below the channel, but without waiting for the rebound.
Aggressive traders may short now, hoping to ride the correction toward the bottom. Given that they would be trading against the trend—which is clearly a bullish charge that would turn today’s price into a hammer, (though ultimately insignificant since it's lacking a meaningful preceding decline or other corroborating support)—a tight trade plan is essential.
Here’s an example:
Trade Sample – Short Trade
- Entry: $600
- Stop-Loss: $620
- Risk: $20
- Target: $500
- Reward: $100
- Risk:Reward Ratio: 1:5
