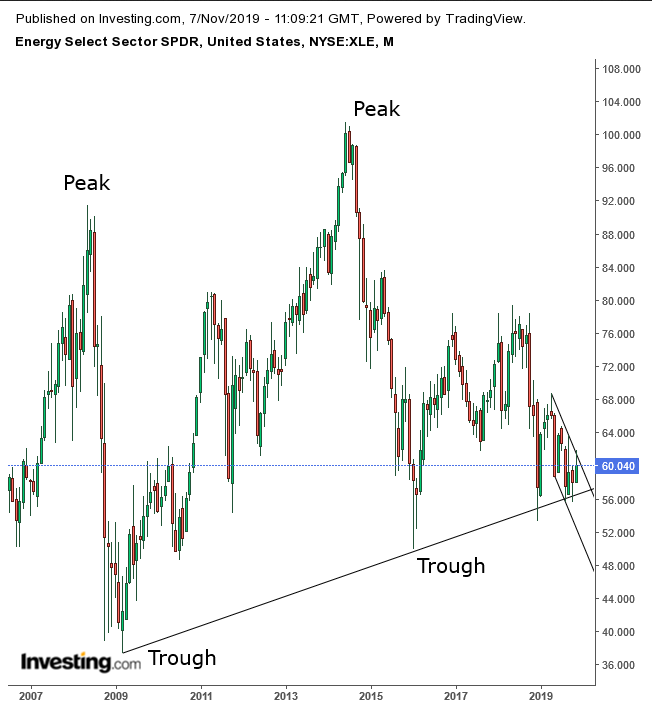
Ironically, while WTI is in a long-term downtrend, the energy sector, via the Energy Select Sector SPDR (NYSE:XLE), is in a long-term uptrend. This means its current low may just be the ideal entry point patient investors dream about.
To be sure, the energy market, complex in the first place, has become more complicated with a multitude of exceptional conditions: the trade war, the longest expansion on record, near-zero interest rates in the U.S. and negative rates abroad.
And on top of that, energy managers face a growing demand for renewables. The range of variant, oft conflicting trends analysts must master to provide an estimate of where prices might head is enormous.
Demand for oil has been slowing, fund managers are balking at the size and cost of Aramco’s IPO and Brazilian oil action is characterized as a “total disaster." So why invest in energy companies now?
- Energy valuations have remained the lowest across multiple time frames. The sector has been undervalued at -6.64% over the past 6 months; -13% over the past 12 months; and finally, -30.85% over the last 5 years. And each time, it's been the only sector in the red.
- Energy firms have been escalating buybacks and raising dividends.
- Iran’s warmongering is likely to disrupt Middle East oil supply.
- The outlook for the U.S. economy is that it will pick up, thanks to a resolving trade dispute and a Fed whose support is growing.
This all demonstrates how extremely complex the fundamentals of the sector are. The following technical analysis helps illustrate some of the developing trends seen in the chart.

The Energy ETF is in a long-term uptrend, with rising peaks and troughs. The current slump is considered, according to principles of technical analysis, a support-retest. While, a support can always fail — especially with so many different drivers — the odds are in favor of a rebound and, potentially, a continued uptrend. Either way, from a risk:reward perspective, this is the ideal entry point. The position matches the trend and is very near its support for a relatively small exposure.
Why the mismatch between the sector and oil? For one, gas is already in an uptrend and has bottomed. Second, stock investors are forward-looking and tend to be ahead of the curve.
Trading Strategies
The energy sector fell after Chesapeake Energy Corporation (NYSE:CHK) plunged on disappointing revenues and yesterday’s inventory count revealed that demand has been lower. The fall completed a bearish pattern, confirming the resistance of the top of the falling channel since the April high at $69. We’d wait for the price to break through the falling channel or return to the long-term uptrend line, depending on risk aversion.
Conservative traders would wait for the price to breakout and complete a full return move that confirms the trend reversal.
Moderate traders are likely to wait for the return move for a better entry, not necessarily to confirm support.
Aggressive traders may go long either on a return to the uptrend line and the August-October lows above $55, or for an upside breakout of the falling channel.
Trade Sample – Long Entry Position
Note: The trade sample is just a sample. It only attempts to play the odds and demonstrates key components of a responsible trade.
