We have been consistently bearish about equity markets for some time, because of unjustified valuations against the backdrop of the worst economic data in 70 years, and warnings from the Fed – which were repeated yesterday – the IMF, the World Bank and a slew of money managers. Nevertheless, stocks have seen the greatest rally in years, despite these fundamentals and some technicals.
Perhaps today's broad sell-offs are due also to a fresh wave of COVID-19 infections in the US as lockdowns continue to loosen. However, the strongest rally in years has also taken place during the worst of the pandemic.
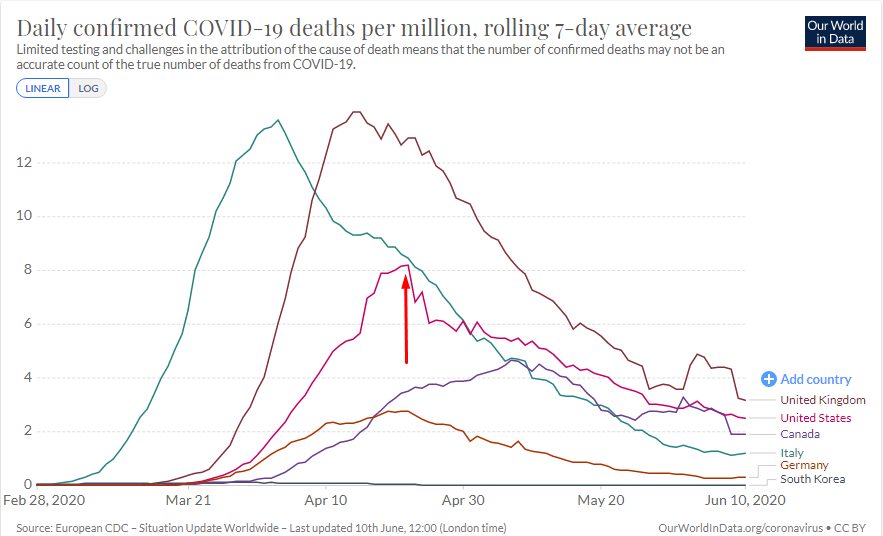
By the time deaths per million peaked in the US at 8.15 on April 22, the Dow Jones Industrial Average had exploded higher by almost 29% from its March 23 low, when the mortality rate was just 0.17.

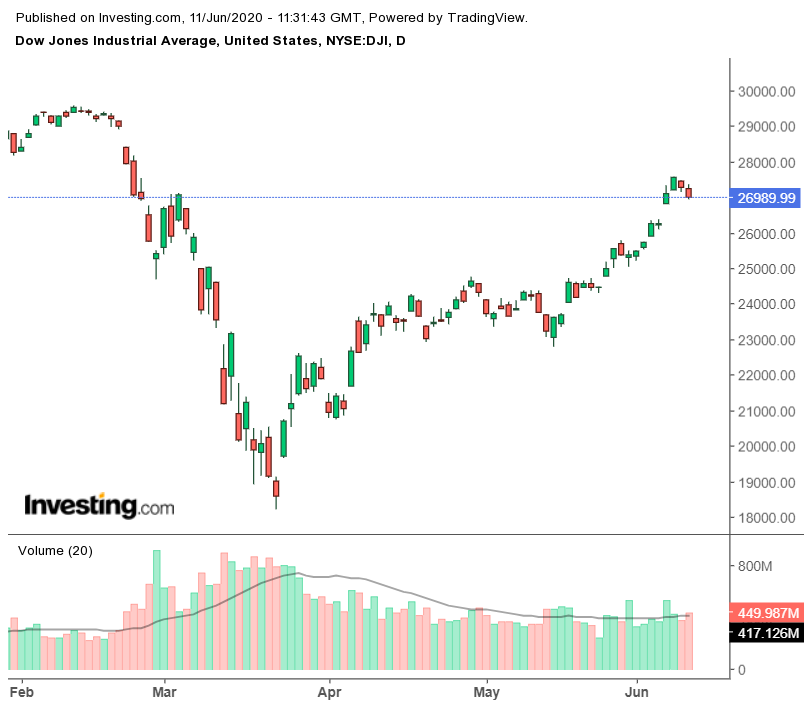
Yesterday, the Dow Jones completed its first back-to-back decline in nearly a month. Let’s remember, however, that the last two-day selloff was followed by a rally, even though it followed a bearish pattern – a small H&S top within another bearish pattern – a rising wedge. Both patterns failed when market dynamics flipped, leading to a short squeeze and encouraging the bulls. Therefore, we are now making a bullish call for the short- to medium-term, in which we see prices eventually retesting February’s all-time highs.

However, since the last two-day selloff that ended Mar 13, stocks have surged by nearly 21%, blowing out two innately bullish patterns and cutting through the 200-DMA, like it wasn’t even there, in the process. So, for now, a pullback is in order, as investors lock in profits and wait for a signal on where to go from here.
The June 5 upside gap – the third leg up in this move that has taken place since the May 14 low – is concerning. Think of it as a last, desperate effort to continue higher. The problem is that when demand dries up, there is no support left, leaving traders hanging, ahead of any selling. This might be a setup for an Island Reversal, complete with a downside gap. However, if there is no falling gap, and the index does display some accumulation above the failed rising wedge, convergence at this point with the 200 DMA will create a technical pressure point and we would expect the rally to continue.
The upside breakout of the rising wedge that we have seen has taken place on the back of growing volume. Notice how volume has rounded out, gradually declining from those initial heavy levels until bottoming out. Now, with this recent breakout, volume is rising again. Also, the 20 DMA for volume has been breached for the first time in this recent leg. Similarly, the Advance-Decline also jumped along with the price breakout, and has declined in line with the current selloff.
On the other side, RSI is topping out after reaching an extremely overbought 86.6 and the ROC has provided a negative divergence. However, neither momentum indicator has yet broken below uptrend lines or previous troughs. Therefore, if the price finds support above the falling wedge, and these indicators remain above their previous lows, traders might see this as a point at which to enter a long position.

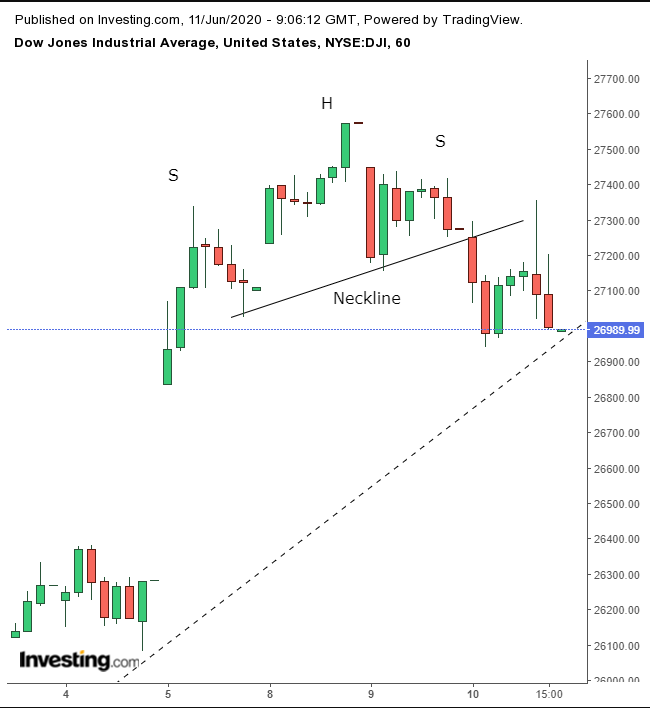
Either way, we expect at least a short-term pullback, after the hourly chart completed an hourly H&S top, which has proven itself with a return move after the penetration didn't even last the hour
Trading Strategies
- Conservative traders should wait for support confirmation by the failed rising wedge, with a new high above the June 8 price, then wait for a pullback.
- Moderate traders may be content with risking a long position with a base above the rising wedge.
- Aggressive traders will probably enter a contrarian short, depending on the hourly chart and the market’s ripeness for correction.
Trade Sample – Aggressive, Contrarian Short
- Entry: 27,000
- Stop-Loss: 27,200
- Risk: 200 points
- Target: 26,400
- Reward: 600 points
- Risk:Reward Ratio: 1:3
