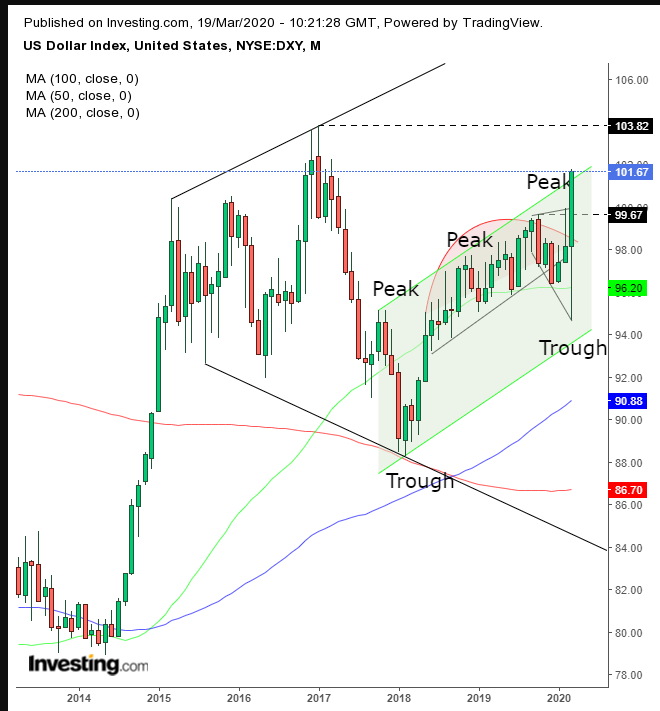
There have been two previous, major financial markets crashes in the past 20 years. During both, the U.S. dollar became the life raft of choice that everyone wanted to cling to.
The more recent, 2008 crisis saw the S&P 500 Index fall 57.69% between the high of October 2007 and the low of March 2009. Five months later, the Dollar Index accelerated, going from the March 2008 low to the March 2009 high to add 26.76%.
The earlier, 2001-2002, collapse saw the S&P 500 decline 50.5% between its March 2000 peak and its October 2002 trough. At that time, the dollar’s bottom preceded that of the SPX top. The USD moved from the low of October 1999 to the top of July 2001, gaining 24.08%, from bottom to top.
On Monday we forecast that now, the dollar will ultimately repeat its pattern of becoming the quintessential safe haven asset amid this ongoing market crash. We did think, however, that it would fall before it rose, since it was trading according to a broadening pattern, which sets up the dynamics for a fall.
We expected the dollar would bounce off the bottom of the generally bearish pattern, using it as a springboard to break through its ceiling and beyond. But that's not what happened. Investors didn’t want to wait that long and provided an upside breakout quicker than we anticipated.
Does that mean that the dollar’s path is now clear to just keep rising from here on out?

The USD is certainly within an uptrend. However, when taking a longer view, it’s been trading sideways since March 2015, in a much larger broadening pattern.
At this point, it’s impossible to say anything with authority, as the pattern speaks of the indecision and general panic of traders. In other words, they themselves don’t even know what they want.
While this pattern tends to appear at market tops, it requires a downside breakout for it to be complete.
But, due to its diverging trendlines, it’s inherently very difficult to determine when the pattern is complete. In addition, the same applies to its blow out.
It’s impossible to say for sure when an upside breakout fails. A pattern’s failure forces the market in the opposite direction from where it was expected to go, in this case, becoming bullish.
For now, we can only provide bite sized trading analyses, while reiterating that when equities have fallen hard, as they did in the previous two market crashes, the dollar reigned supreme.
Trading Strategies
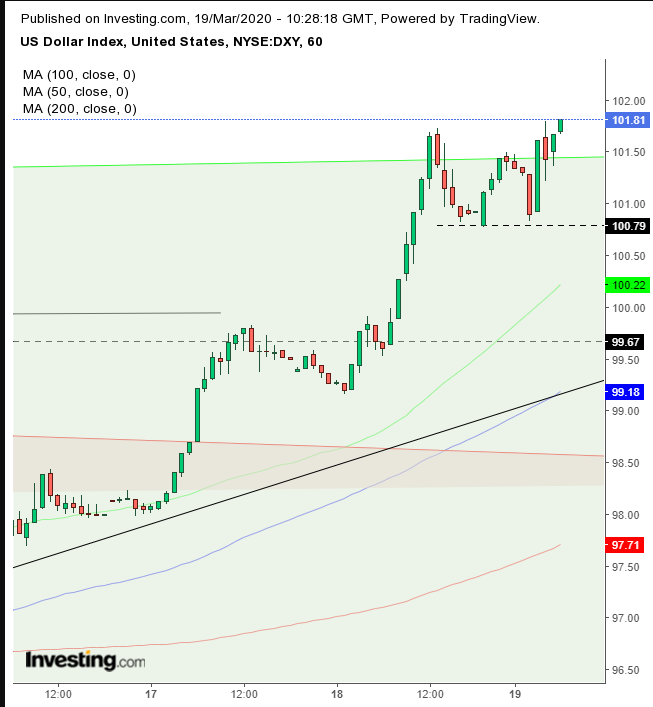
Conservative traders would wait for a pullback toward 100 and evidence of demand, before committing to a long position.
Moderate traders may wait for a return move, as well, for a better entry, not necessarily for a bounce to confirm support.
Aggressive traders may enter a contrarian trade, using the hourly chart, in case of a double top. Still, it is against the general trend. So, this move is only for traders who have a high threshold for risk, both in temperament and in capital.
Contrarian Trade Sample
- Entry: 100.80, after falling first to 100.50 and retesting the double top’s neckline
- Stop-Loss: 101.00
- Risk: 20 pips
- Target: 100.00
- Reward: 80 pips
- Risk:Reward Ratio: 1:4
