President Donald Trump took to Twitter to renew his attack on the Fed over the weekend, blaming quantitative tightening for the stock market’s lack of continued record highs. The president claims stocks would be up to 10,000 points higher and GDP would have topped 4 percent if the U.S. central bank hadn't raised interest rates at the end of last year.
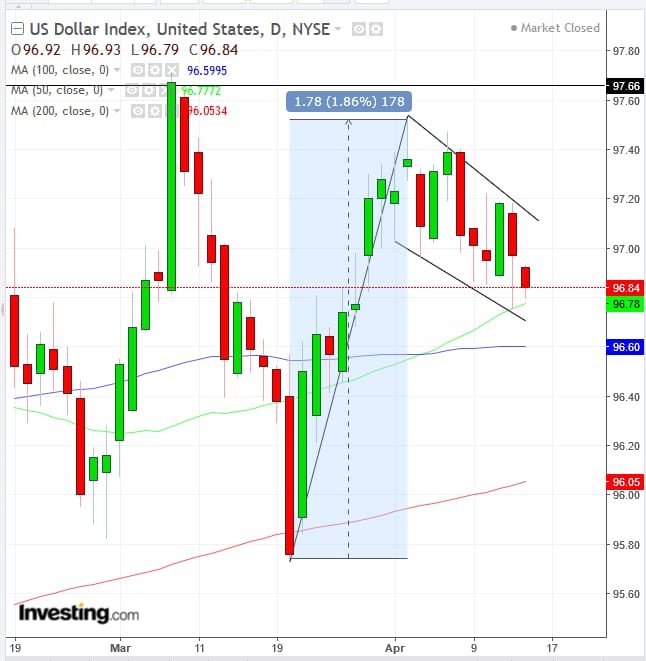
Traders responded by selling the dollar for the second day, after Friday’s risk-on provoked investors to sell off Treasurys. However, USD technicals are signalling that the drop may only be temporary. Based on the pattern we see in the chart below, we're still bullish on the greenback, and believe it's pulling back to get ready for its next leg higher.
While the dollar is set to close at the lowest since March 27, we consider the decline part of a “falling flag” trading pattern, bullish after the 1.86% jump within the 9 sessions from March 21 to April 2. The presumptive dynamic is that the first bulls are taking profits after the surge, while new bulls are gearing up to overcome the March 7 peak.
Note, the flag bottom is finding support above the 50 DMA, after it crossed the 100 DMA, and the whole move bounced off the 200 DMA.
The pattern would be complete with an upside breakout, and the presumed target is the move – or flag pole – prior to the flag body, in time and price depth. Our bullish outlook for the dollar is a mirror image of our bearish view for the euro.
Trading Strategies – Long Position Setup
Conservative traders would wait for the upside breakout to include a higher peak above the March 7 high, followed by a return-move that would retest the flag’s integrity, with at least one long, green candle engulfing a red or small candle of either color.
Moderate traders would wait for the upside penetration, preferably that would trade higher than the March 7 high, with a return move for a better entry, but not necessarily for trend integrity.
Aggressive traders may risk a long position now, when the price is at the bottom of the presumably bullish pattern, supported by the 50 DMA and 100 DMA, provided they have a management plan, which includes such a trade.
Trade Sample
- Entry: 96.80
- Stop-Loss: 96.60, 100 DMA
- Risk: 20 pips
- Target: 97.40, below the flag’s highs
- Reward: 60 pips
- Risk-Reward Ratio: 1:3

