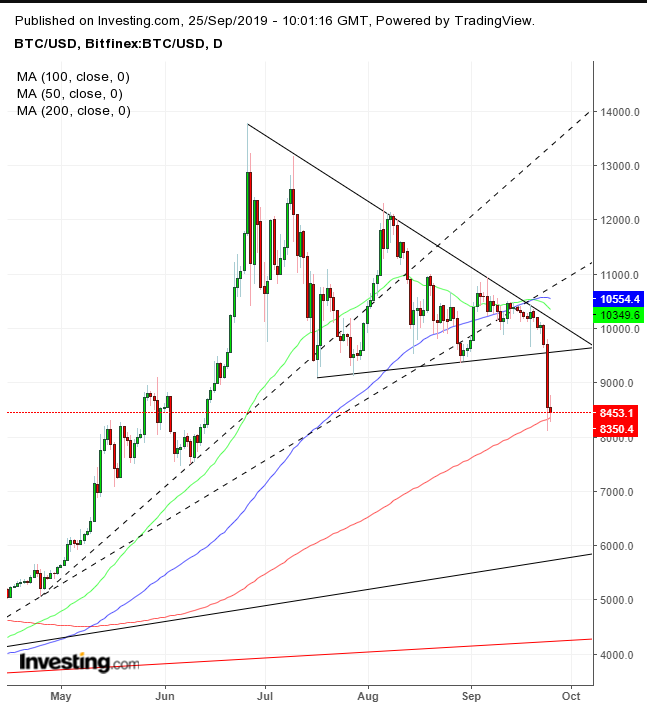
Bitcoin’s deep plunge yesterday may be a signal that the biggest digital currency by market cap is about to fall even further. The purported long squeeze—when leveraged long positions are hit with margin calls—has set Bitcoin on a path toward $6,000.
We've been monitoring Bitcoin’s pattern development since July, waiting for the next stage of a decline. This now appears to have arrived.
After yesterday’s 11.9% plunge, we expect this to be the first leg within a persistent selloff, once the price falls below the supportive 200 DMA. The 50 DMA already fell through the 100 DMA for the first time in 10 months, preceding a 50% drop.
The trading pattern since June has developed into a mostly descending triangle. The dynamics of this market are such that supply outpaces a demand that attempts to push back but ultimately fails. The extreme downside breakout demonstrates just how overwhelmingly supply overcame demand.
The 100 DMA has been supporting the price for the second day, and it's reasonable expect it could aid in a return move to retest the pattern’s integrity. Once the price does fall below the 200 MA —which coincides with the May-June congestion, in which many traders participated and are therefore likely to remember those prices—the next major support is the uptrend line since the February bottom.
That would be the third uptrend line, after supply pushed prices below two steeper trend lines (dotted) from March and then April. Should the third uptrend line fail to hold the price, it would signal a steeper decline toward the uptrend line since 2016, above the $4,000 level.
For now, the descending triangle’s implied target is $5,000 (red uptrend line), but as stated, the uptrend line may prop the price above $6,000.
Trading Strategies
Conservative traders would wait for a return move to retest the reversal with a second fall to a close below the 200 DMA.
Moderate traders may be content with a pullback for a better entry but not necessarily to wait and see that supply overcomes demand.
Aggressive traders may enter a contrarian position now, going long, counting on a return move that follows what would be interpreted as an exaggerated move.
Trade Sample – Contrarian Long Position
Which stock should you buy in your very next trade?
AI computing powers are changing the stock market. Investing.com's ProPicks AI includes 6 winning stock portfolios chosen by our advanced AI. In 2024 alone, ProPicks AI identified 2 stocks that surged over 150%, 4 additional stocks that leaped over 30%, and 3 more that climbed over 25%. Which stock will be the next to soar?
Unlock ProPicks AI