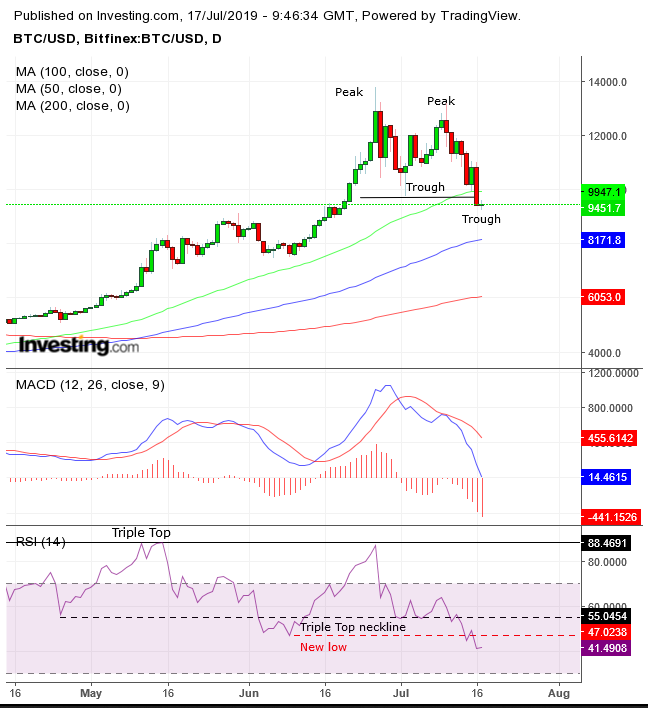
Bitcoin’s 25% plunge over just one week has now put the crypto king into an official bear market — a clear demonstration that government and regulatory criticism is more than just rhetoric.
The price fell before the $10,000 psychological round number, which so many experts have counted on for support. If that’s not enough, the new low completed a double-top reversal, demonstrating that sellers are willing to lower prices till they find willing buyers.
This downside breakout lead to two questions: Will sellers find buyers at the current levels? And if not, are sellers desperate enough to keep lowering prices till they do find willing buyers?
The charts reveal a bit more about what's likely to happen.

The price completed a double-top, as it fell below its 50 DMA, its natural uptrend line since February. The double top established two falling peaks and troughs, required for a downtrend, in which advances are considered corrections within a continued selloff.
The RSI has completed a triple top since April, as if to say the rally since is over. The momentum-based indicator also notched below the June low, suggesting prices may follow suit, dropping below $7,500.
The MACD has confirmed a sell signal, when the short MA found resistance below the long MA during the second top of the pattern, after the indicator’s long MA fell below the short MA when completing the first top of the reversal formation.
While all these signs display weakness, traders need to be very careful of a possible bear trap. To avoid being whipsawed out of positions traders employ filters, tending to range between 1% and 3% for the price filter and one and three days for a time filter, with a weekend hedge considered an added protection. However, given that this asset’s volatility far outpaces price fluctuations in traditional securities, we have suggested in the past to employ a 10%-30% price filter and a week to three weeks’ time filter.
While we’re not eulogizing cryptocurrencies, we recognize that they are in a downtrend. We expect that with exponential changes in technology, the way we store and trade value will surely evolve, as financial assets such as Bitcoin bottom.
Trading Strategies
Conservative traders should wait for a 30% penetration of the neckline over a period of at least three weeks before committing to a short position.
Moderate traders may be content with a 20% penetration and a two-week period.
Aggressive traders could short on a 10% penetration and one-week period in which prices remain below the neckline. Traders should consider waiting for a pullback to minimize exposure and increase risk-reward ratio.
Trade Sample – Short Position
- Entry: $9,500
- Stop-Loss: $10,000
- Risk: $500
- Target: $8,500
- Reward: $1,500
- Risk-Reward Ratio: 1:3
